.svg "quintly-logo (1)")
Delivering excellent customer service on social networks is more important than ever for brands all over the globe. Recently KISSmetrics released a very informative infographic about the impact of customer service and how bad customer service may hurt your business. According to their analysis the majority of people expect brands on Facebook and Twitter to respond at least within a day.
In order to verify how pages are doing in terms of response rates and also response times on Facebook, we have looked into our data sets how those numbers developed over time for the period from January 1, 2013 to April 30, 2014. The analyzed data set covers 76,734 Facebook pages with a minimum of 1,000 likes/fans and a total of 75,581,519 user posts on those pages.
The response rate is defined by the share of questions in form of user posts on Facebook pages that were answered by the specific pages within 14 days after the questions have been posted. quintly is using an intelligent algorithm to identify real questions using a variety of indicators.
Facebook Response Rate Development
The following chart shows how the response rate developed from January 1, 2013 to April 30, 2014.

As you can see, the average response rate has increased by 5% within the analyzed data period, leading to an average of 42.4% in April 2014. Of course, this is a positive development. But in reverse it also means, that well over 50% of users questions are not getting answered.
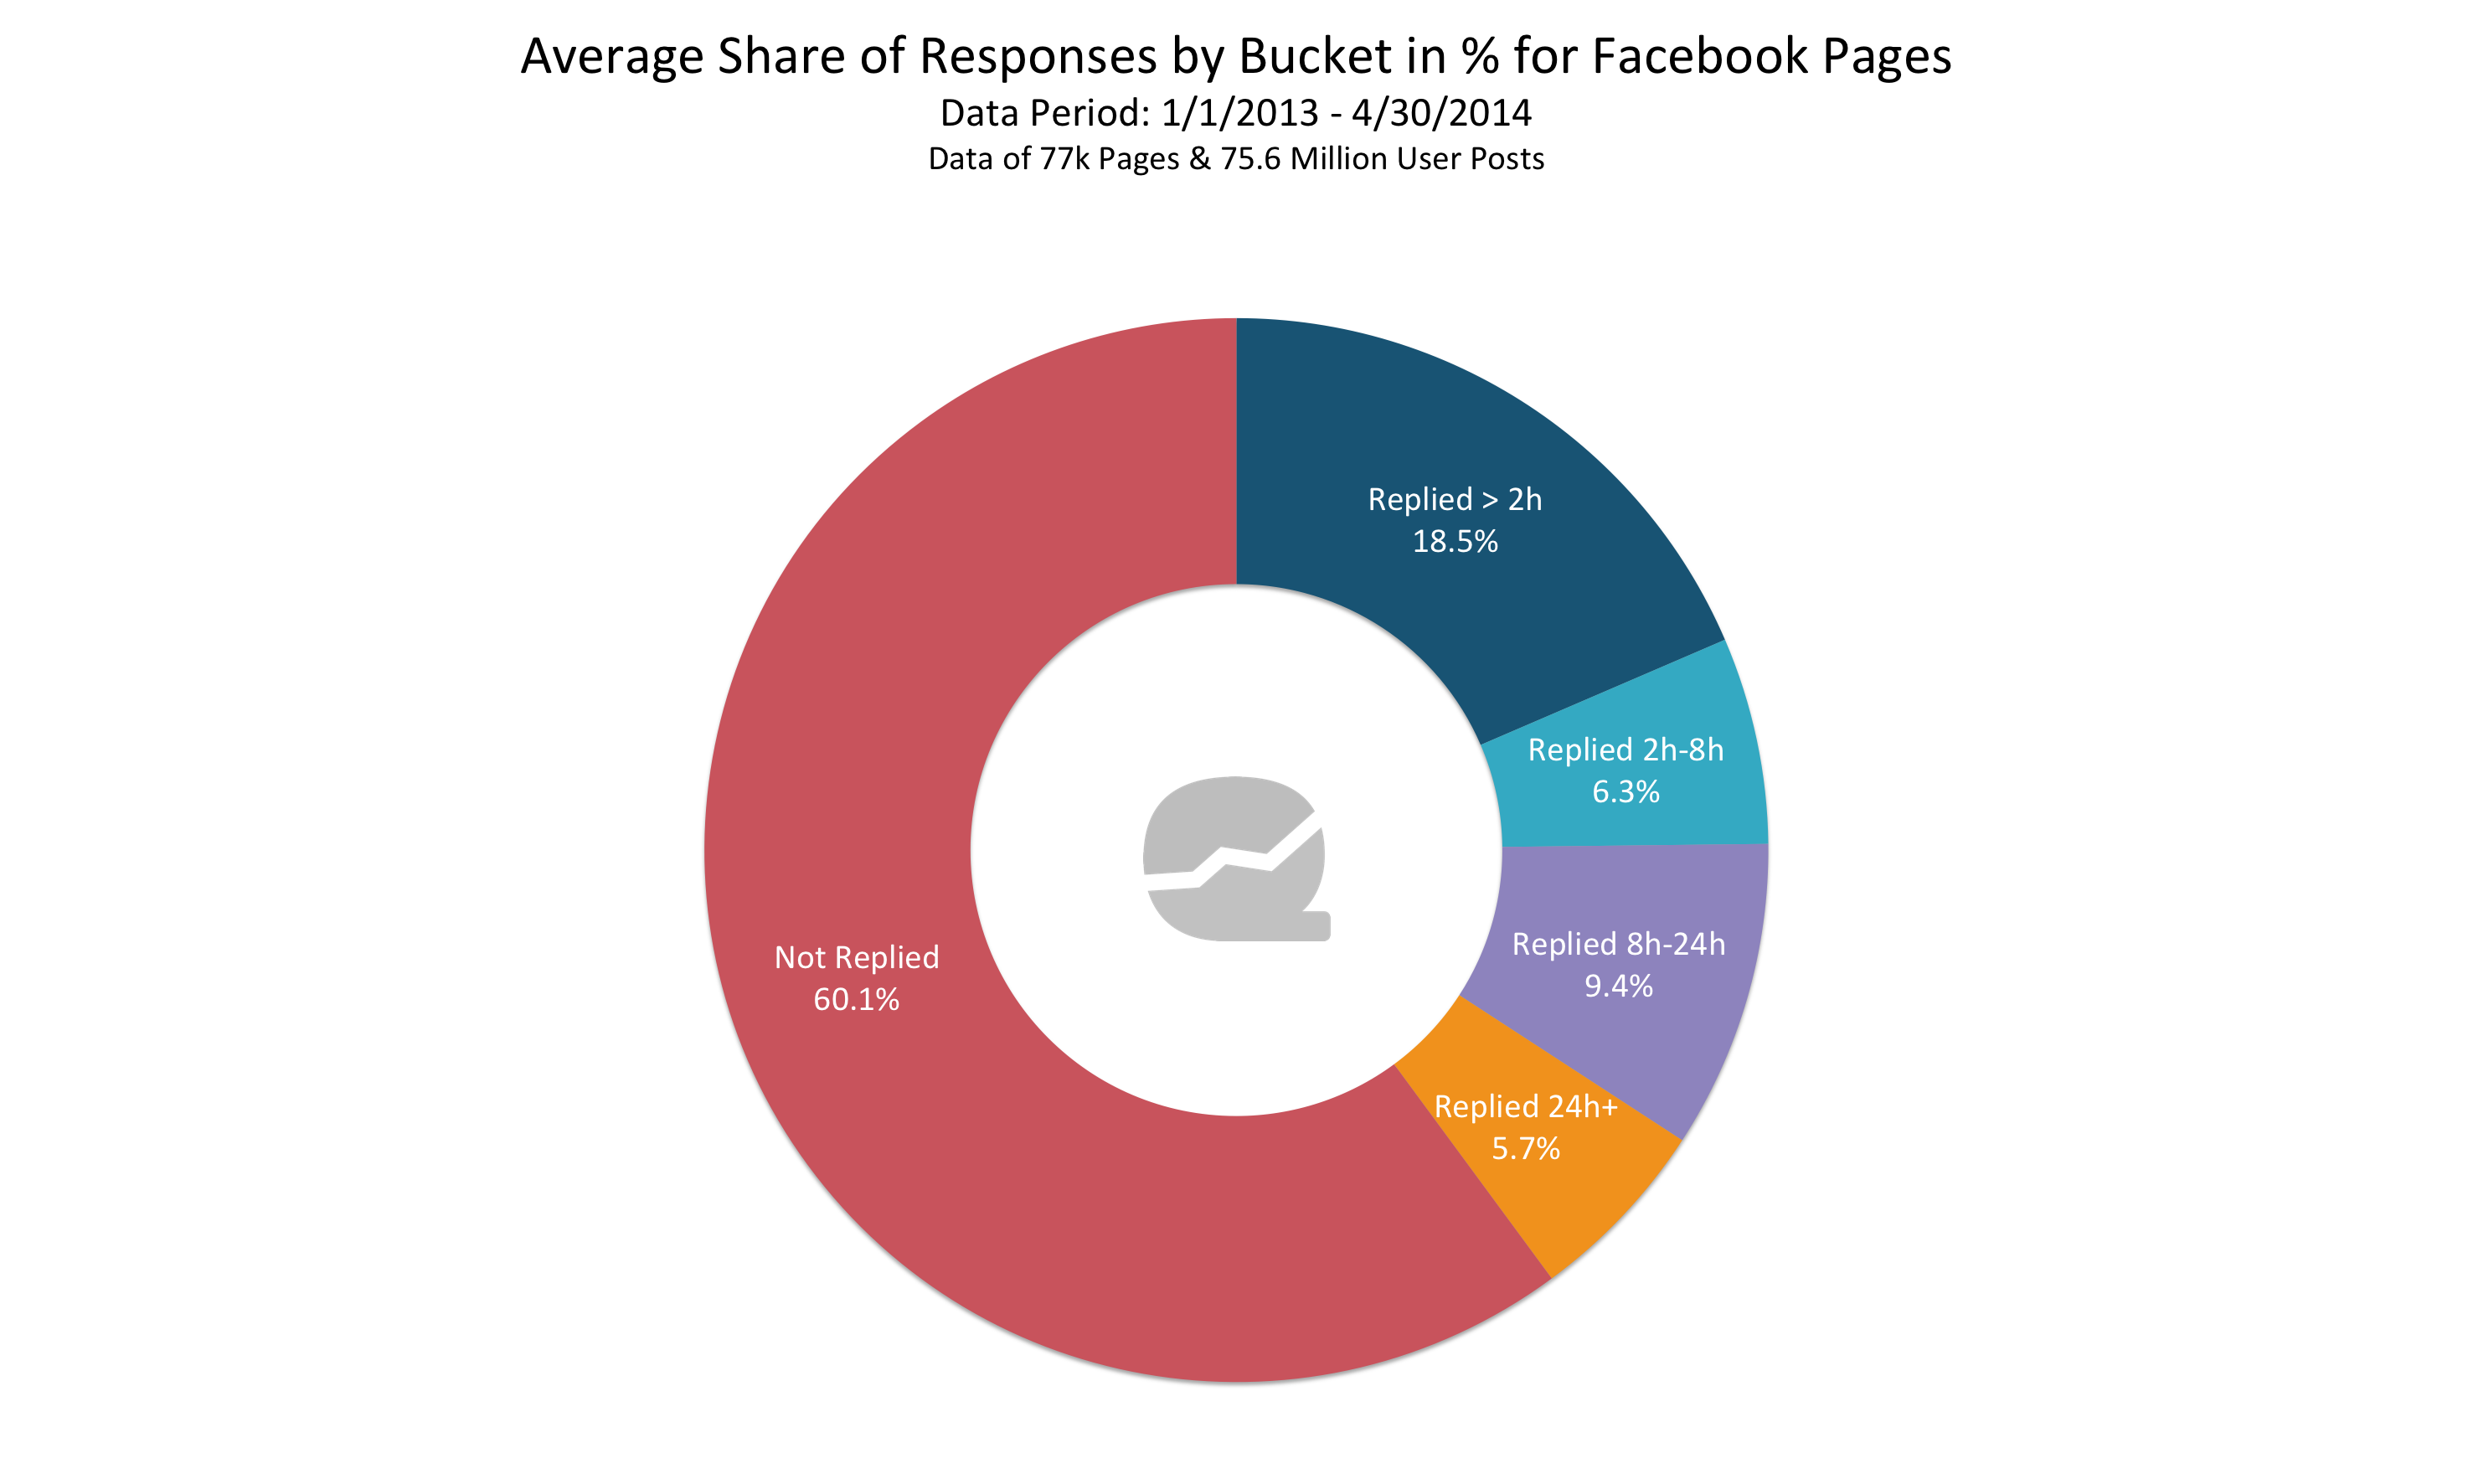
Average Share Of Responses By Time Bucket
For a deeper understanding on how brands are replying to user requests we split the response time data into five time buckets:
- Replied in under 2 hours
- Replied in between 2 and 8 hours
- Replied in between 8 - 24 hours
- Replied after 24 hours
- Not replied

In this chart we used the average values for the regarding time buckets over the whole analyzed time period.
A really positive sign, on average 18.5% of user question are getting answered by Facebook pages in under 2 hours. That is really good social customer service. Furthermore, 6.3% of the detected user questions are getting a reply in between 2 and 8 hours while 9.4% of user requests get an answer in between 8 and 24 hours. Remembering that users on Facebook want to have an answer from a brand page within a day, we now see that 34.2% of user request get a reply in the desired reaction time.
Only 5.7% of all analyzed user requests have been answered after a period of 24 hours. But on average 60.1% of user questions never got an answer.
In fact that makes clear that Facebook page owners still have a lot to do to improve this obvious lack of support.
Response Rates By Facebook Pages By Weekday
Another question is, if the distribution in response time buckets is different by weekday?

The different time buckets are nearly on the same level from Monday to Wednesday and on Sunday. Friday seems to be the worst day for a user to ask a question as on this day 63.5% of all request are not getting a reply. Furthermore, the time bucket for questions answered later than 24 hours on Fridays shows clearly the largest share with 12.5%. For Saturday the same applies as for Friday, with the difference that now the time bucket of 8 - 24 hours creates the largest share with 12.2% compared to every other day of the week.
Conclusion
Social media has enabled both consumers and brands to interact and share content on a public stage. Our data analysis of the Facebook response times and rates proves that there is still a lot to do for brands to optimize their social media customer support. In fact, it isn’t that easy to fulfill all customer expectations on social platforms. Social customer support requires guidance, planning and, of course, measurement. Check this 7 musts for social customer success.
For even more charts, data and valuable insights take a look at this presentation:

Join the conversation. Leave us a comment below!