.svg "quintly-logo (1)")
It’s that time of year again. December not only means getting Christmas presents for your loved ones; It also means having to take closer look on the year's performance before we can celebrate the new year with some fireworks. The following blog post takes our Social Media Benchmarking Study as a source for referencing in order to set social media goals properly.
How to… Social media goals
What do the right social media goals mean? An important characteristic for goals: they need to be achievable. In order to set up realistic and thus achievable goals, it’s valuable to have a benchmarking reference, such as comparing with an average. In all of our social media studies, we analyzed certain patterns in specific networks. However, the following study shows these averages on a basis of 220,000 social media profiles for Facebook, Twitter and Instagram. When referencing benchmark numbers as we do in this case, it makes sense to cluster by different sized pages. By splitting metrics in six different groups any marketer has the ability to use our data as a benchmark reference. Now, let’s talk numbers for the right social media goals in 2017!
Instagram profiles growing fast
Looking at the Growth Rate (taking the average number of followers in the start of the month and in the end, into account) we can see that Twitter and Facebook are more or less stable in the analyzed months. Focusing on the shooting star Instagram, it becomes clear that the follower growth is significantly higher, but decreasing. A decreasing Growth Rate is a normal phenomenon when a network becomes increasingly “mature.” The finding here show that Instagram profiles still grow at a significantly faster pace than the average Facebook page or Twitter profile. Keep that in mind while setting your social media goals for next year.
In terms of followers, the goals on Instagram can be higher than on Facebook and Twitter. You need to think of interesting and engaging content that helps you interact with your new followers. We as a data driven company have to tell you: Always think of the right KPIs to measure your content!
In our study, we split the growth rates into different clusters, as mentioned above. In this table, it becomes apparent that small profiles grow especially fast. Instagram profiles up to 100k followers grow by a two digit (!) number on average. This is what I call big potential in order to reach new people! In relation to bigger profiles, Facebook especially seems to have reached a certain level of saturation.
The Growth Rate might increase step by step again, as Facebook starts to bring people online who did not have access to the Internet by sending internet-delivery drones into space.
Amount of posts stable
Own post frequency gives great insight in understanding the focus and the way in which businesses are communicating. Post frequency appears stable in the analyzed period. In this case, the selected timeframe is quite short, but looking at the numbers from our Twitter study (that analyzed the behavior of Twitter users during the whole year of 2015), you can see that during that year, 4.5 tweets per day was the usual post frequency as well. With this social media study we identified the same case with the amount of daily tweets, but with a slight positive trend.
Interaction Rate by far highest on Instagram
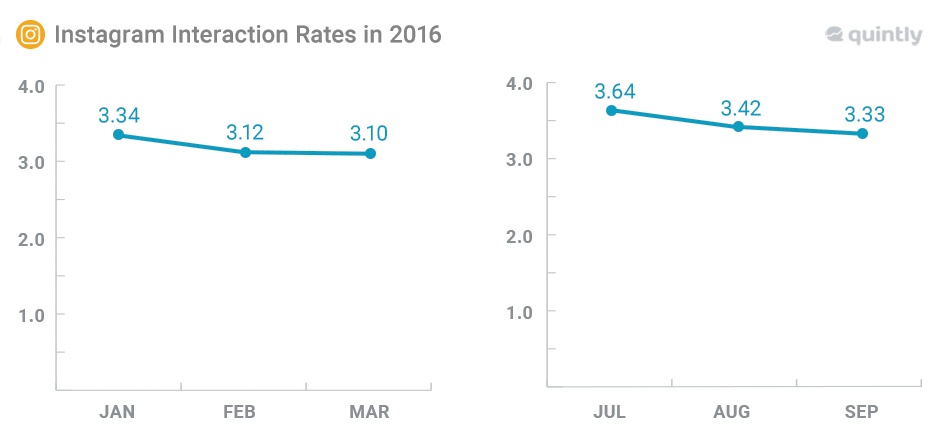
The Interaction Rate can be a great indicator for the success of a post, especially in relation to other profiles and pages. In our study, it’s apparent that the Interaction Rate on Instagram is on a higher level than on Facebook and Twitter. This means that the average posts receive significantly higher interactions in relation to followers or fans. This is great news for marketers! Now we should compare these numbers to the Interaction Rates in Q1 in order to identify either an increase in interactions or a decreasing trend.
Comparing the two quarters, you can see that the Interaction Rate is not decreasing and Instagram stays strong throughout the year. Taking a look at the averages of the two quarters (3.18 in Q1 vs. 3.46 in Q3) a slight positive trend is present. That’s even better news for marketers. So, be ambitious on Instagram next year and try to utilize the potential for your business! Key to that is not only a good startegy but a flexible measurement approach for Instagram.
When a network becomes more mature, you would normally expect decreasing growth and interaction rates. However, in Instagram’s case, this is not necessarily true.

Join the conversation. Leave us a comment below!