.svg "quintly-logo (1)")
Instagram Growing Rapidly - Interaction Rate Drops
After our popular Instagram Study of Q1, we are happy to share the latest Instagram Analytics stats. Since the last study Instagram grew rapidly and we reported steadily increasing interaction rates on the photo-sharing platform in other blog posts and studies published. Here is a quick overview of the main findings:
Post Frequency
The average Facebook Page posts 1.48 per day whereas the number of posts grew from an average 0.89 to 1.11 times per day on Instagram. Facebook average number of posts remains unchanged in the same time period. Analyzing Facebook pages with more than 100k fans, we found that these selected pages tend to post more often than smaller pages, which is an ongoing trend from Q1.
Audience Growth Rate
This rate shows how strong the average growth on the average Instagram profile or Facebook page is. Growth gets more difficult to realize the bigger the network gets but this number shows some interesting insights into user adoption. Instagram audience growth rate was 17.7 % during Q2, while Facebook pages on average just grew around 1.9% during the analyzed period.
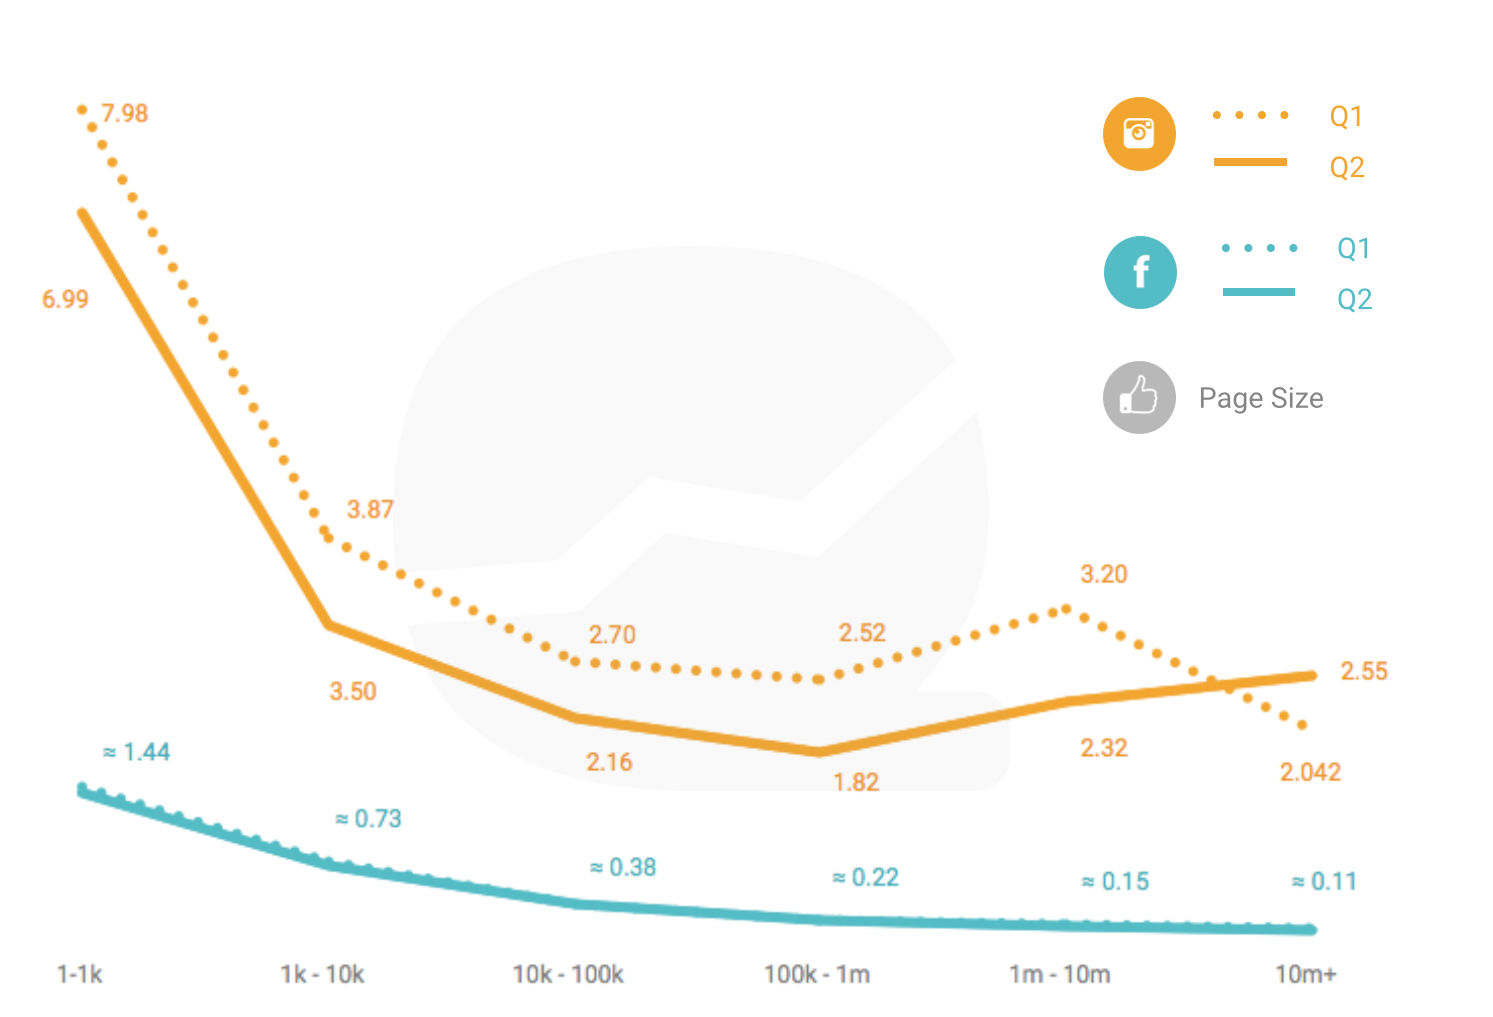
Interaction Rate
The interaction rate dropped considerably in Instagram and significantly less in Facebook. This happened due to the increase in fans and number of posts in each network, where Instagram grew more and promoted a higher activity from publishers, hence a higher drop in the I-Rate.
Video / Image Distribution
In our first Instagram Study this year, we reported images were 93.78% of the timelines. Remaining by far the most frequently posted post-type, videos rose during Q2 to 10.23%, which is a growth of over 4 percentage points. According to our previous study, videos have the highest interaction rates compared to any other form of content. The rise of video interaction underlines the fact that businesses seem to get more attractive for the average user.
In our comment on Instagram Study Q1 we mentioned that it will be interesting to monitor the development of Instagram after the “first hype”. Phenomenons like dropping Interaction Rates are normal due to the increase in followers and number of posts but are still highly relevant, especially for businesses advertising on the platform. For Q3 and especially for the analysis after 2015 it will be interesting to see if this trend continues or if interactions grow at the same pace as the number of followers.
Instagram has several challenges to overcome now. First, it will be important for Instagram and its stakeholders to earn more money, which should not jeopardize the user experience. Second, Instagram has to keep their users active and the network itself appealing for their users.
For businesses who are active on Instagram and potentially sending financial resources in advertising it is important to note the following:
There is no “EdgeRank” yet on Instagram, which makes it easier to reach your followers, compared to fans on Facebook. Important to note here is that the average Facebook Page has significantly more fans on Facebook than followers on Instagram, whereas you have to spend money to appear in the timeline.
Marketers should evaluate the use of videos for Instagram and Facebook as they perform on the same level as images but the interaction might be considered from “higher quality” as the user spends up to 15 seconds (on Instagram) consuming the video. Hence, the brand has more possibilities to bring their message across. Furthermore, think of uploading native Facebook videos, as they perform better than YouTube links. Soon, we will publish a study related to that, so stay tuned.
In the end, every decision which is made has to be validated with the help of data. Marketers should analyze individually if the increasing frequency of posts on Instagram affects the interactions per post. In case you feel the necessity to do so, just reach out to us. Any questions? Just send a tweet.

Join the conversation. Leave us a comment below!