.svg "quintly-logo (1)")
Before we start to focus on buying christmas presents, decorating trees and sipping our favorite christmas tea, we just want to use this last opportunity of the year to show some of the most interesting social media stats of 2015. In this blogpost, we would like to summarize the major studies we published last year and present you all social media stats in one place. After checking back on our own blog, we can say, that you will find quite some interesting studies which were published - with a lot of interesting findings.
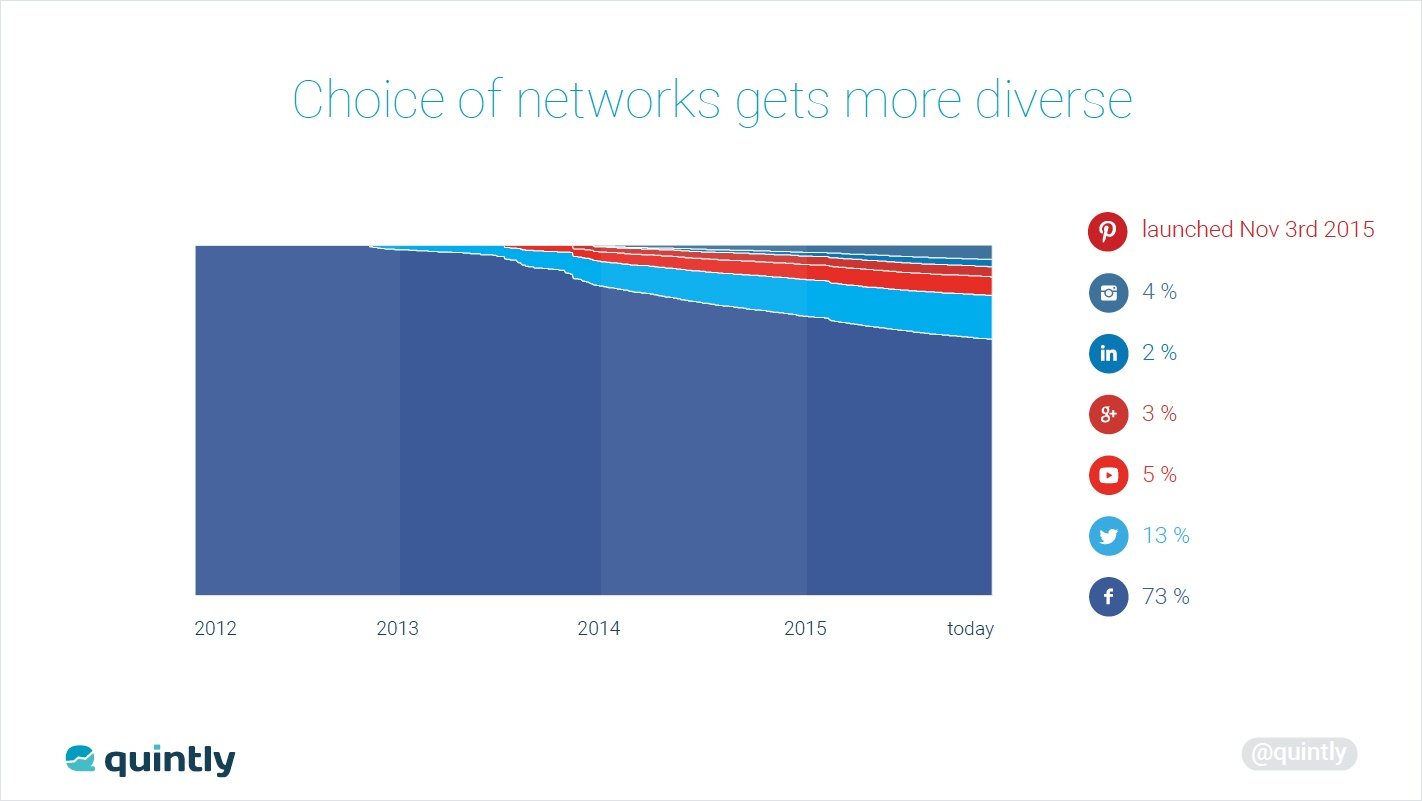
Looking back, 2015 was the year of live-streaming services such as Meerkat, Periscope and Blab. People started to enjoy being news broadcasters either on small or bigger scale. And businesses started to enjoy having their own news shows, too. We have seen several examples of how businesses can use the new possibilities in a creative way. Instagram was reported as the shooting star this year. Every conference was full of “How brands can profit from Instagram” and blogs reported - so did we - it's high interactions. Once Instagram ads were rolled out to all users, it started to get meaningful for numerous businesses. Beside these stars this year, many reported Facebook losing traction, popularity and people would turn their back to the “top dog” in social media. However, let’s have a look at a first social media stats from our studies.
Facebook Stats 2015
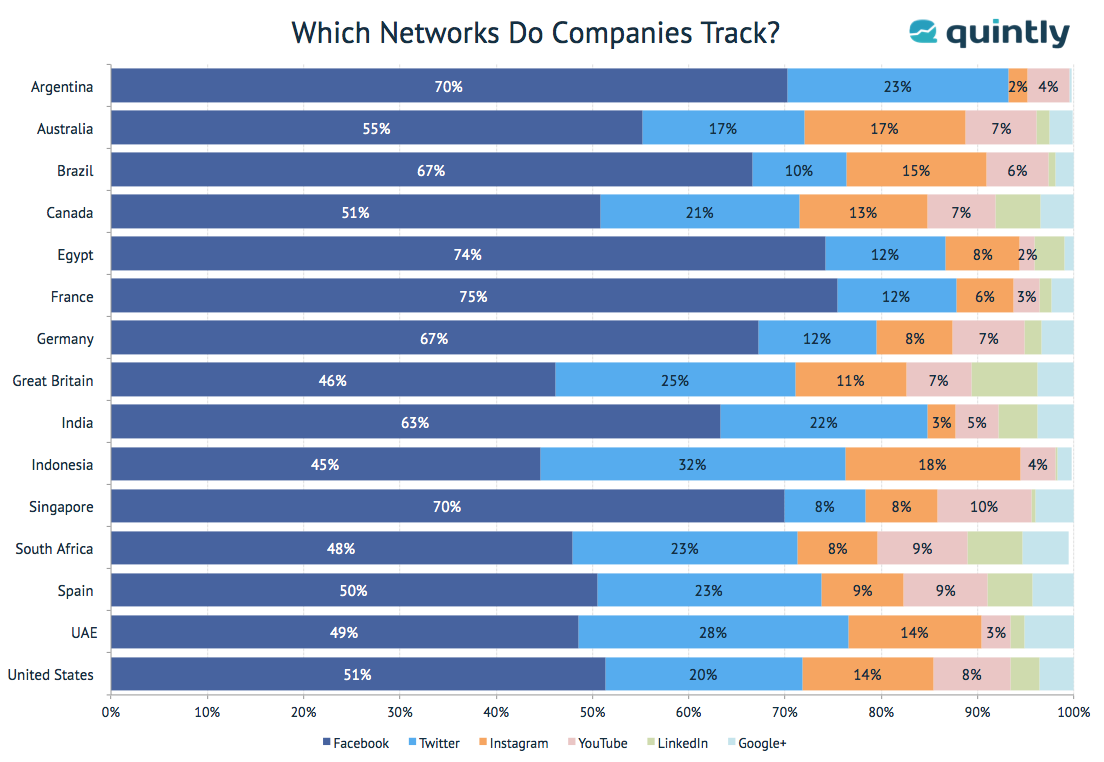
In this study, we investigated how over 50,000 quintly users use our platform to optimize their social media strategy and split the findings in 15 countries. In the following chart we displayed the major findings and revealed the different network usage depending on country. Interestingly, Facebook plays a significantly bigger role in France than in the US or Canada. France, India and Argentina are adopting Instagram very slowly whereas it seem to play a major role in UAE, Indonesia and Australia.
On top of that, our Facebook study in September showed some other interesting social media stats, showing which post types receive the highest engagement. Based on 8 Million Facebook posts we found out that videos and image posts drive highest interactions. To get a deeper view into posting patterns of brands, have a look at our Facebook post analysis, or simply download it as a good read under the christmas tree.
Instagram Stats 2015
Let’s get back to the rising star of 2015, Instagram. We published two studies, in which we analyzed more than 5,000 Instagram profiles. Summarizing both we can say:
- The post frequency on Instagram rose from 0.89x per day to 1.11, Facebook remaining almost unchanged ar 1.48
- The share of videos in Instagram timelines increased from 6 to over 10% during the last year
- Images and videos perform on the same level
- Instagram remains King of Interactions but we reported a drop in the Interaction Rate the first time in Q2 2015
The numbers revealed, underline how important Instagram can be for businesses as part of their strategy. The fact that there is no “EdgeRank” on Instagram yet, makes it easier and most of all cheaper for companies to reach their followers, compared to Facebook. If Instagram stats are interesting for your business, we recommend our Instagram Study from Q2.
Pinterest Stats 2015
Having said that Instagram is the King of Engagement, we have to consider one important factor: It is not possible to share content per default. Which makes it for businesses using Instagram harder to leave their own network of fans. After adding Pinterest Analytics to our tool in November, we published some interesting stats with two revealing studies on our Pinterest Analytics Blog. In our first Pinterest Study in October, we found that the post frequency is significantly higher on Pinterest than on all other networks (18x per day). Important to note at this point is that Pinterest is not organized in a timeline view as all the other networks, thus it is not obtrusive to upload numerous different products in a single day. Online retailers such as Asos and Zalando are great examples therefore.
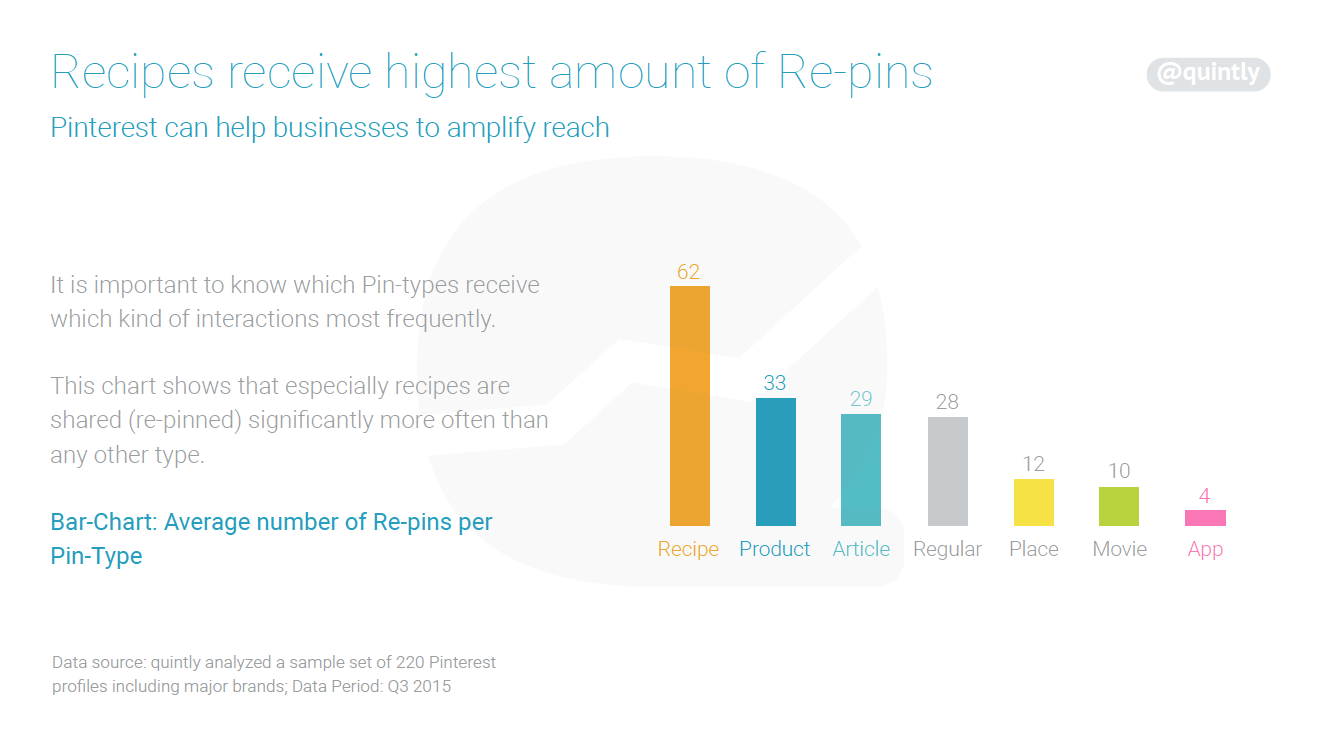
Going deeper into the analysis, we took a closer look at Pin-types which are shared most frequently and which of those received the highest amount of interactions. ‘Regular Pins’ are shared most frequently with 60 out of 100. More interesting is to answer the question if these Pin-types receive the highest amount of shares, too. In our Pinterest Study from Q3 we were able to detect that recipes and product Pins receive the highest amount of Re-Pins. Thus, it might be a good opportunity for businesses, marketing on Pinterest, to publish these Pin-types more often.
The purpose of our social media benchmarking study (with infographic) was to compare all these social media stats. Therefore take a look at our infographic. In beginning of 2016 we will publish the updated version again. So better stay in touch, and subscribe to our blog :)
Now, we wish you a Merry Christmas and Happy New Year of Analytics!


Join the conversation. Leave us a comment below!