.svg "quintly-logo (1)")
Last week, we looked at different social media interaction metrics. By first comparing different networks, we found that Facebook, Twitter and Instagram offer rather similar features for engagement, excluding the latter as it doesn’t offer native sharing. Optimizing your social media measurement is essential for understanding your performance better. This will help you improve your strategy and campaigns more efficiently.
Essential interaction metrics for your social media measurement
Let’s continue with a couple more interaction metrics. In our last article we focused on the overall interaction rate, the interaction type distribution and the interaction rate per post type. This time we want to look at some more metrics that are related to time. Besides, we will take the Key Influencer Metric into account that shows you your most active followers. Furthermore, we will consider the Hashtag Detection metric that can show the most successful hashtags. As before, we will not only explain the metrics themselves but also consider a real world example by analyzing the global brand Mercedes-Benz for February 2016.
Find your best performing content with the Interactions/Post Comparison
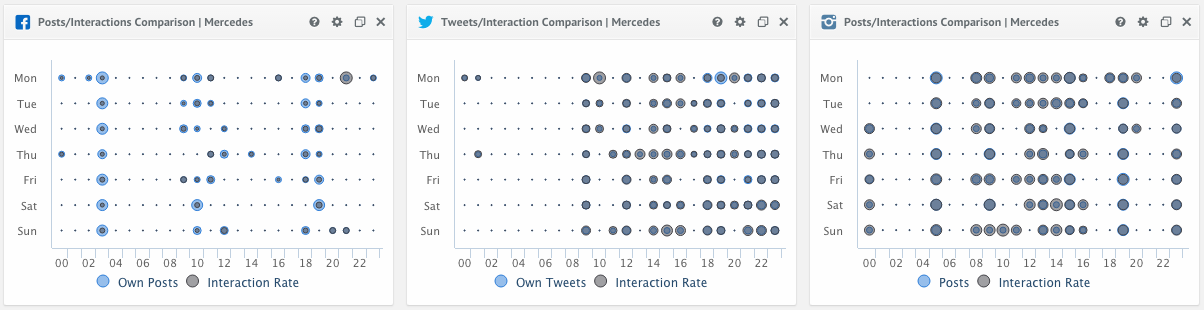
The Interactions/Post metric let’s you compare the effects of your own posts and the following interactions by day and hour superimposed in one bubble chart. It helps you to detect on which day and at what time a profile gets the highest interaction rate. This way you can easily see at what time and day of the week how many users interacted with how many own post by these pages by average. This of course can vary depending on the industry and easily reveal certain and valuable user interaction trends.
In the case of Mercedes Benz, you can see that the interactions almost exactly overlap together with the time of the posts on all three networks. On Twitter, posts are much more frequent than on Facebook. This, however, is related to the mechanics behind the service that does not generally sort the tweets on your timeline. Thus, it is more common to post a tweet several times. In Facebook and Instagram you can see posts that happen in the very early morning by a Western European Standard. This shows that Mercedes Benz is also trying to target different time zones and they have probably done their social media measurement right.
See your most successful Day: Interactions Rate by Weekday
This metric compares the interactions for posts of a specific weekday irrespective of the follower count. The result is a combined index of likes, shares and comments per own post, standardized by the total amount of own posts and fans. So basically, this metric shows you the days of the week when your users are most active.
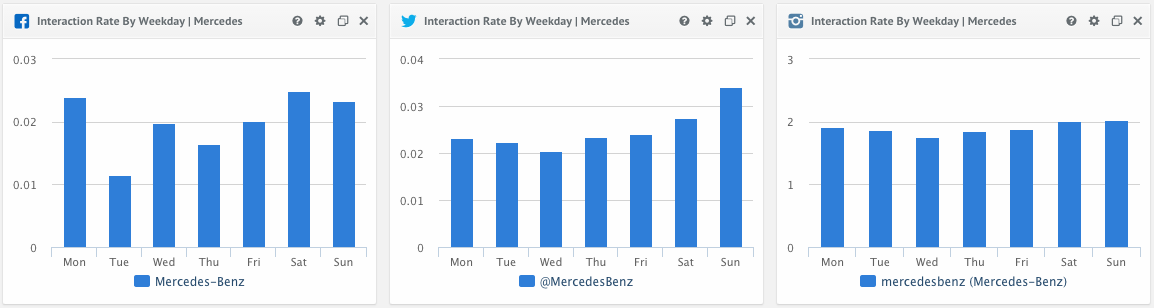
For Mercedes Benz, we can see that on Facebook Monday and Tuesday are rather strong weekdays, while Wednesday and Friday are especially weak. The strongest days on Twitter are Friday and Sunday, while all weekdays are rather similar on Instagram where we generally find the highest interaction rates. Based on this, you might go a bit deeper and look at the content you post in order to find out how it might cause the lower interactions on certain days. On the other side, you might draw conclusions regarding what content works best.
Compare your Performance with the Overall Interaction Rate per Network
This handy metric for your social media measurement allows you to comparatively analyze the interaction rate per network. For each network the interaction rate is calculated as the sum of interactions divided by the number of posted content, normalized by the audience size. Considering this data will help you determine which network might work best for you and thus where you need should invest more resources.
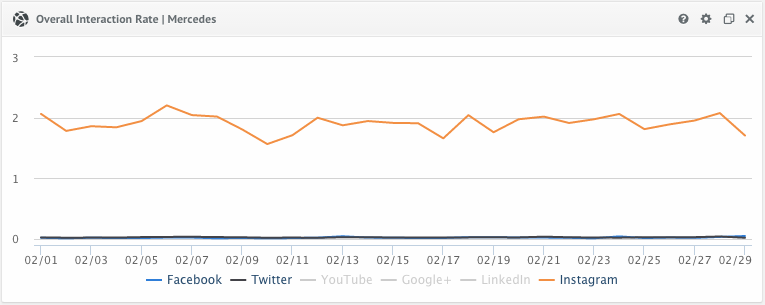
For Mercedes, this metric shows that Instagram gains the highest interaction rate among the three chosen networks. It might thus be fruitful to put even more effort into the photo network. However, it must always be remembered that every network has its own advantages and disadvantages. If you want to get more information across, Facebook might be the better choice as it is not so much focused on images. Furthermore, as Instagram has no default sharing option, you might in the end have more interactions, but less new people seeing your content.
Find your Key Influencers
The Key Influencers metric will allow you to easily identify the key interacting users of your profiles. For Facebook, the table chart shows how often those user posted and commented on a page during a selected time range. Using this metric with more than one Facebook page will show possible overlaps. This even may help you to recognize previously unknown competitors of your page on Facebook. The metric for Twitter is a bit different. The table chart shows how often those user mentioned a profile during a selected time range. Using this metric with more than one Twitter profile will show possible overlaps. This may also help you to recognize previously unknown competitors of your profile on Twitter. Please keep in mind that 'Mentions' include retweets and replies by users.
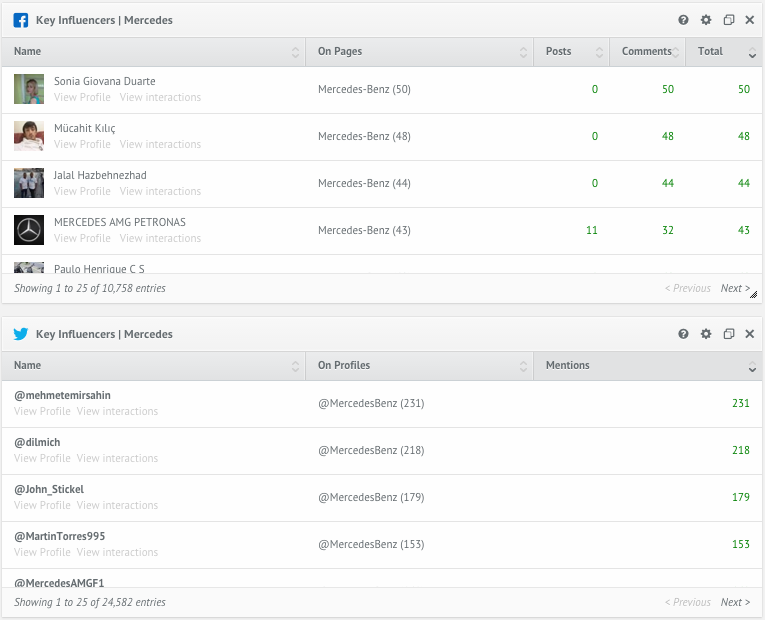
For the Facebook page of Mercedes you can see that the top influencer has left 50 comments in February 2016. On Twitter, the user with the most mentions has used your profile name in 231 times. Identifying your most active users can have several advantages. For example, it can help you prevent damage if this influencer is posting many bad comments on Facebook. But you can also find the users that really like you and bind them even closer to you.
Detect your most relevant Hashtags
The Hashtag Detection metric shows a table of the used hashtags that gained the highest interactions. For Twitter profiles, it includes the number of posts in which the hashtag was used, the number of favorites and the total quantity of tweets and retweets. Lastly, you can see the total number of interactions. The Instagram metric is essentially the same, except that it shows likes and comments. Theoretically, there are also hashtags on Facebook. However, they are not being used much thus don’t play relevant role.
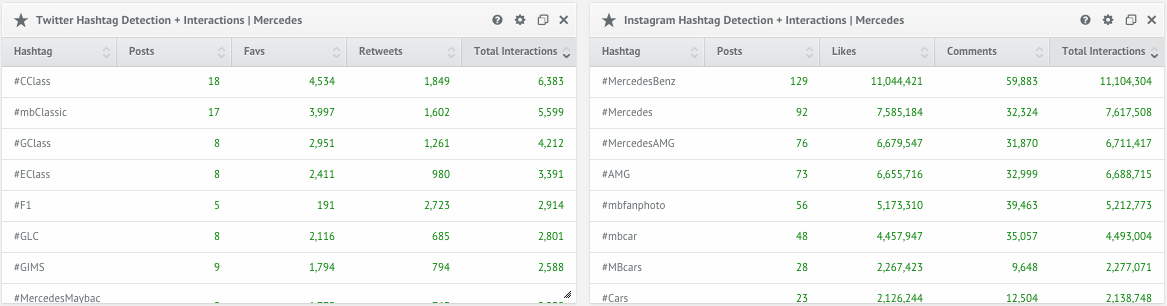
Our case with Mercedes shows that #CClass received the most interactions on Twitter. This might show that a certain hashtag has been wisely chosen and thus became successful. However, you also have to consider the number of tweets have used the #CClass. So as it was used in 18 tweets, it is in any way more likely that it gains more interactions than a hashtag that was only mentioned in one tweet.
Deep social media measurement with interaction metrics
The four discussed metrics go much deeper than looking at basic social media KPIs like the total number of followers or the amount of own posts. By using social media interaction metrics on a regular basis, you will be able to optimize your strategy in a more professional way.
Have you used interaction metrics so far? If not, start optimizing your social media analytics process now!

Join the conversation. Leave us a comment below!