.svg "quintly-logo (1)")
Since six weeks Facebook users have been able to react differently than just with 'Likes' on a post. The little animated emojis give people new possibilities to engage with a post and now quintly users can measure these results. Starting with this information in Facebook Insights, you are now able to track Facebook Reactions for your pages.
Facebook Reactions are not only a great way for users to express their feelings but also a helpful new feature to measure how content is perceived by your community. In order to further optimize their social media strategy, businesses can now track the way people reacted on their posts. Through the 'Wow’ emoji, for example, it can be differentiated whether your content is good or rather excellent.
Reactions are going to change the way we approach Facebook data and insights. Our users will be able to build new custom metrics such as different 'love scores' together with us in the future. For example, if you weigh the Love Reaction higher than the 'Like', it gets easier to detect how well your social media campaigns went.
Also worth noting: Facebook has said that all Reactions will count as Engagements for the Edge Rank (which determines what will be shown in the timeline). Thus, if someone responds with a ‘Wow’ or ‘Angry’ Reactions, they will see more of your content by influencing the Edge Rank positively.
As mentioned above, for now Facebook just offers this information in Insights and thus users are only able to detect the feelings of their own community. The impact to Facebook marketing will be even bigger when this information becomes public as quintly users will be able to track, benchmark and compare Facebook Reactions with their competition.
Here are some examples of the metrics that are now available in quintly
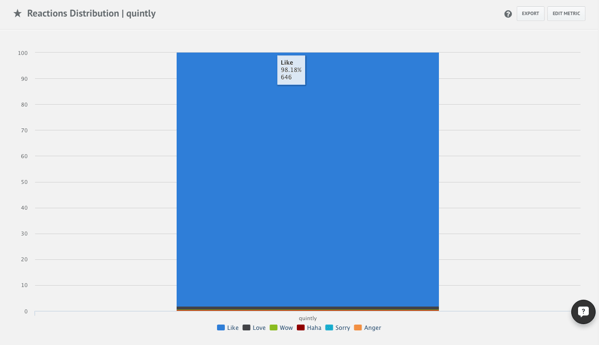
Reactions Distribution
The Reaction Distribution bar chart helps you identify how the received interactions of your own Facebook pages are distributed in the analyzed period of time. It shows the percentage of all reactions on your page at a glance. This metric can help to determine the sentiment of your fans.
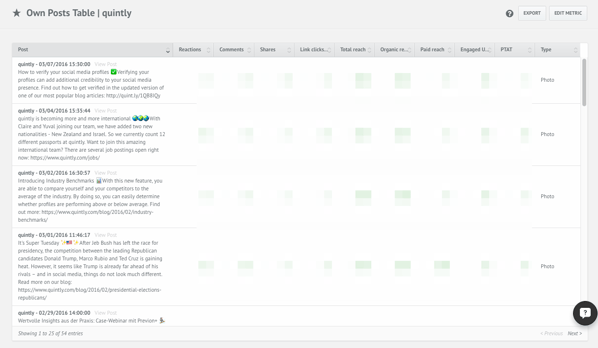
Own Posts Table
It is now possible to include the overall number of the Reactions certain posts got. From now on you can see all Reactions - not only Likes - on a post level. You can furthermore sort your posts according to the total number of Reactions.
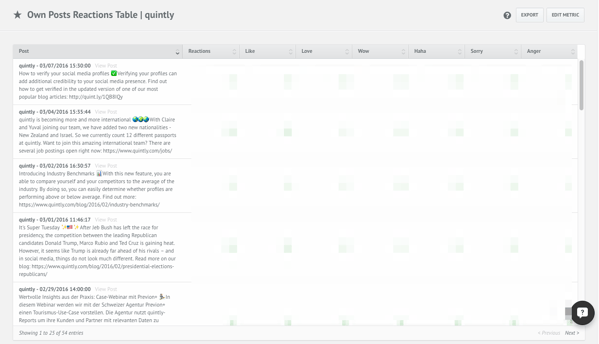
Own Posts with Reactions Table
In the Own Post Reactions Table you can see the total number of Reactions. You can also track all the different types on a post level. Besides, you can sort the posts of your analyzed time frame according to each Reaction type. It is thus possible to draw conclusions on the sentiment of the users to your content.
Track Facebook Reactions now and optimize your Facebook marketing
The metrics shown above are just three examples how Facebook Reaction tracking can be applied. With custom metrics, there are many more options that can be perfectly tailored to your individual goals. Facebook Reactions will change the way how Facebook marketing is done, so start analyzing now!


Join the conversation. Leave us a comment below!