
Before shooting firecrackers in the sky and ring in the new year, everybody who publishes content on a regular basis feels the need for a yearly summary. Now, I somehow have the feeling to do the same. In 2016 we aimed to deliver great content on social media data to our readers. Based on the feedback we received, it worked quite well. A big thanks for all the support and sharing, friends! The following blog post summarizes our most read social media articles and findings we published this year. Finest selection of social media data 2016: Here you go!
Social Media KPIs - Find KPIs that fit your goals
We started the year with a pretty detailed article on social media KPIs. KPIs are definitely a buzzword in our industry. Everything is a KPI and everyone needs to have KPIs. We wanted to structure the use of the word KPI. That’s why we found it helpful to split social media KPIs into three different categories:
- Growth Metrics
- Publication Metrics
- Engagement Metrics
Have a look at this article if you want to get a good idea of what we consider helpful KPIs that can help you measure your social media performance.
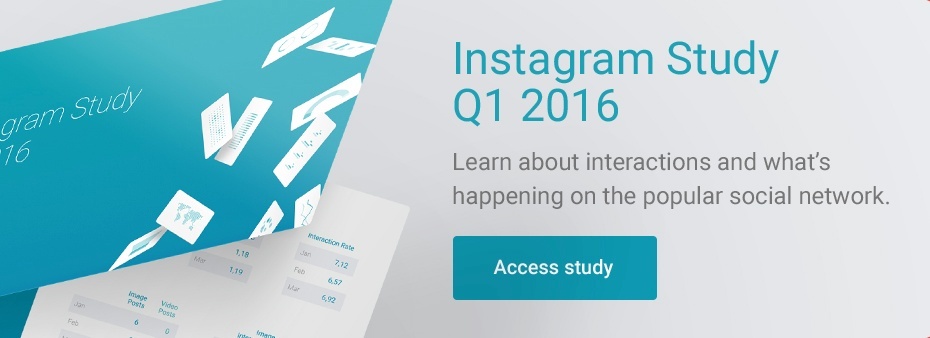
Instagram Study Q1: Instagram Interactions dropped!
In our most read social media study this year, we revealed that Instagram interactions have dropped significantly. Having a closer look at the absolute amount of interactions, we found out that interactions given on images decreased by 27% and on videos by 39%. Why is that?
We tried to find an answer in our blog post from June. After some more research and a discussion with our data scientists, we found two potential reasons for these findings: Due to increasing post frequency, the individual user sees more content in their timelines, but is not necessarily eager to interact more than in 2015. Secondly, we thought that brands joining Instagram with advertising could alienate users. Let’s keep an eye on that in 2017!
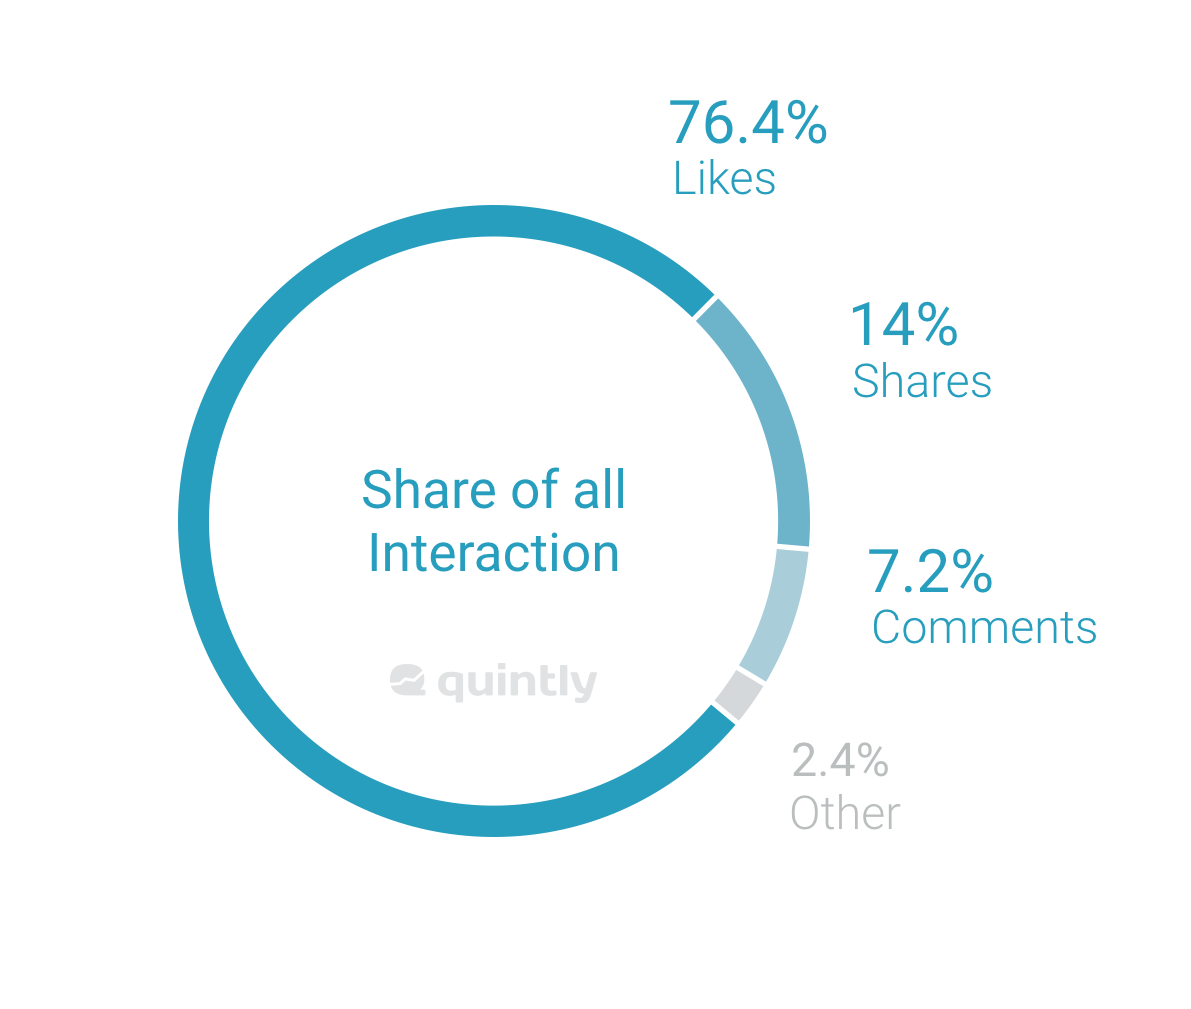
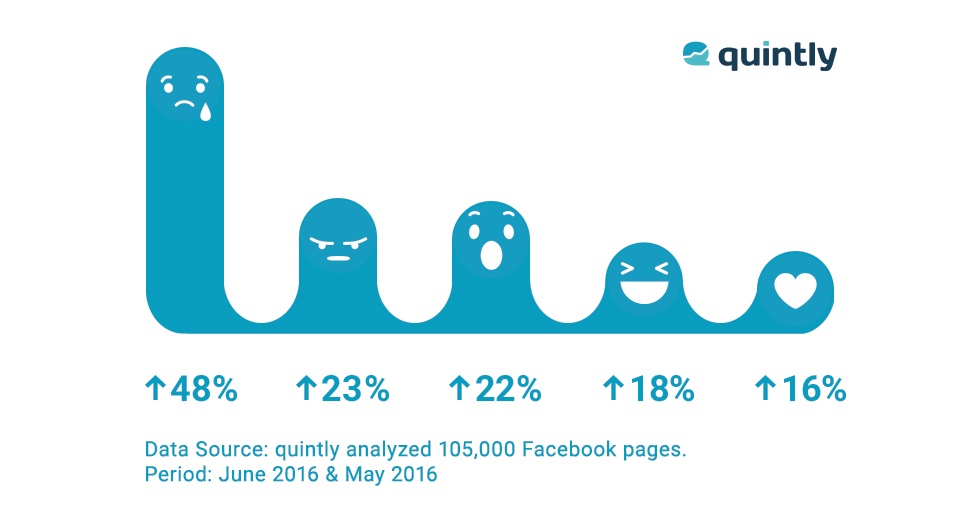
Facebook Reactions are hardly used... Wait, really?
In the end of February, Facebook launched the new Facebook Reactions and consequently gave users the option to express their feelings more accurately. In May, we published a study which became our second most read post this year. It analyzed 130,000 Facebook pages and showed that the newly launched Facebook Reactions had very low significance, compared to all other interactions.
Benchmark Study Q3: Set the right social media goals
As an analytics company we need to point our fingers at the right numbers in order to make decisions. That’s why we published our Social Media Benchmark Study again in December. The study was able to reveal some helpful social media data. In order to set the right social media goals for your business specifically, we clustered the 220,000 analyzed pages. Through this approach this study is applicable for every marketer. The main findings of the study were:
- Instagram profiles are growing fast
- Amount of posts pretty much stable
- Interaction Rate still by far (!) highest on Instagram
By the way: We created a great infographic summarizing the main findings.
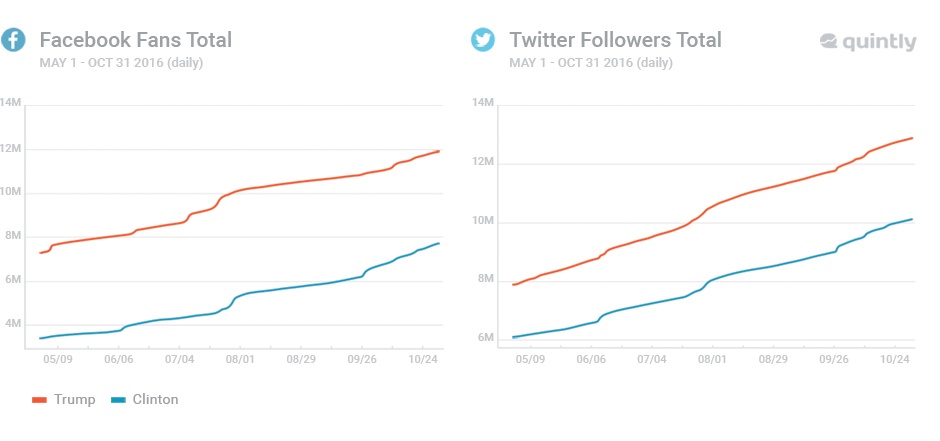
US Election on social media
We can also look back at our first series on a political event. In this case probably the biggest political media event in 2016, the US Elections. Our colleague Tilo dug deep into different facets on how the presidential candidates utilized social media. For many bloggers who referred and cited our findings, the use of sponsored posts on Facebook had been the most interesting.
In case you want to have a look at a summarized analysis of the election period, you will find a detailed analysis for the US Elections on social in this great infographic. Thanks to our design team for this :)
How to combine social media listening & analytics
As one of the last things this year we organized a joint webinar with Mention. Our friends from Paris explained how Mention is able to monitor every single word in the web (brand names, your name or hashtags). After that, I gave a little tour of quintly and showed how I used the tool in order to write the blog post “The New York Times on Instagram”. On top of that, we gave away a free ebook, which you can access on our corresponding blog post.
In the year ahead of us, we strive towards even better social media data for all our readers. Have any ideas on posts? Want to know more about a specific topic? Let us know, we are just one tweet away @quintly.

Join the conversation. Leave us a comment below!