
In our webinar “How to Create a Visual Social Media Strategy and Measure Success“ on August 18 we combined our experience with the insights of Mitt Ray, Founder of Social Marketing Writing.
We discussed how a successful visual social media strategy is set up and measured in the end. In recently published social media studies, we were able to show that many businesses are heavily relying on Instagram, as a purely visual network. Due to low organic reach on Facebook and faster absorbed information on Instagram, interactions here outperform Facebook by far. That makes Instagram, Tumblr and Pinterest the places to be for companies in almost every industry. An increasing amount of resources are being invested in building a presence on such networks but measuring and adjusting their own strategy lacks in many ways. While Julian and Alex covered how to measure social media success part of the webinar, I, Mitt Ray covered the tips on how to create a visual social media strategy.
1. Choose your networks
The first you need to do while creating a visual social media strategy is to choose the right networks to build your presence on. Some of the top visual networks are Facebook, Instagram, Tumblr and Pinterest. A visual presence can be built on networks like Google+ and Twitter too. Don’t try to be active on all of these networks just because visuals perform well on them. Choose two to three to begin with. You need to build a presence on networks where your audience can be found. Data about the demographics of social networks can be found in reports published by institutions like Pew Research. Once you successfully build a presence on the first few networks you can add more to the mix.
2. Make your accounts visually appealing:
To give your audience a taste of what is to come fill your social media accounts properly and make them visually appealing by adding attractive profile and cover images.
3. Create an image posting strategy:
Each social network has a different set of audience hence you need to create unique images for each of them. Don’t post the same image on all the networks.
4. Types of images that work:
Images containing humour, tips and quotes perform well on social media.
5. Consider other factors too:
It isn’t just about the images you post on social media. Other factors like adding text descriptions and hashtags can help too. Also find the best time to post on your various social networks.
Watch the webinar to learn more as I have covered everything in detail there. I have also included some quick tips on how to create visuals for your social media
After we know how a successful visual social media strategy is created and which tools might be considered as essential, we see our duty as a social media analytics provider to show marketers how the effort can be measured easily.
Therefore we decided on some metrics, which reveal actionable insights. Metrics used differ heavily on what you want to show, thus we created different steps in a visual social strategy. The process we chose was easy:
- After you as a marketer understood that visuals are an essential part of social media marketing you either have to convince your boss, upper management or clients
- Therefore you need to back up assumptions with data
- Show best-practice example and how the most successful players in the market are utilizing the power of images
- Switch the point of view from most successful brands in the social sphere to your competition and your industry
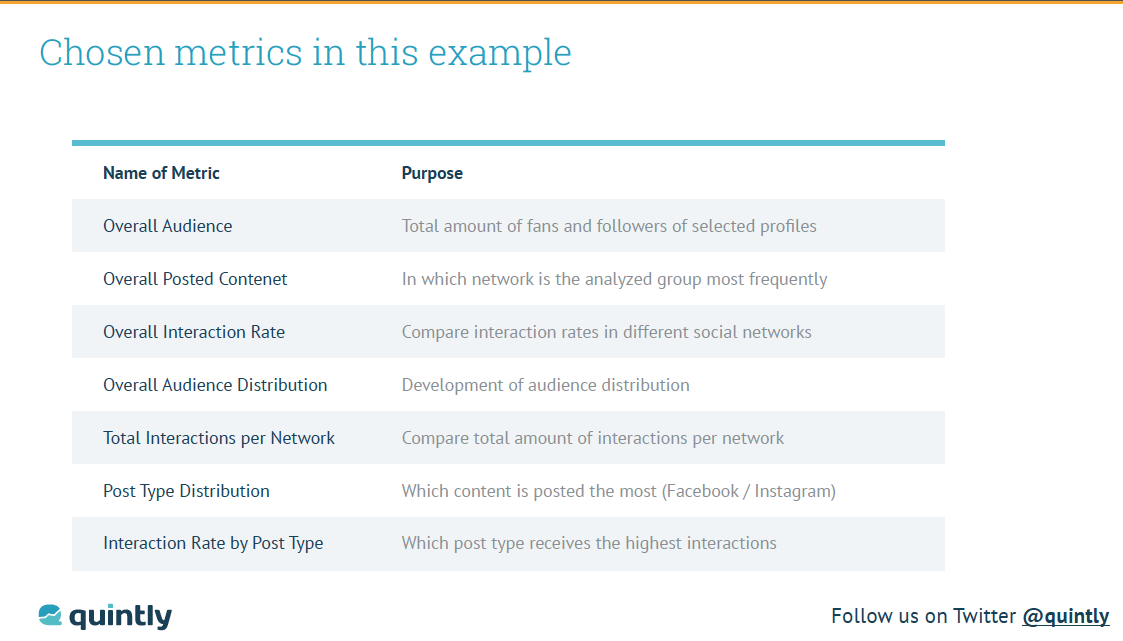
The chosen and presented metrics should help to understand which network is performing best in your industry, which strategy your competition is using, and by checking post frequency in the different networks you can detect which post type interactions are the highest.
In the last part of the webinar we showed how reporting can save time and which metrics are helpful for which purpose.
Any questions regarding the webinar? We are just one tweet away!

Join the conversation. Leave us a comment below!