
When managing and optimizing your Facebook presence, it’s important to focus on your central goals and key performance indicators (KPIs). What your KPIs may be depends on your social media marketing strategy. In this article, I present 5 central social media metrics that could be used as your KPIs, depending on your specific needs and goals. Using the right metrics and KPIs will make the whole publishing process more structured and easier to follow.
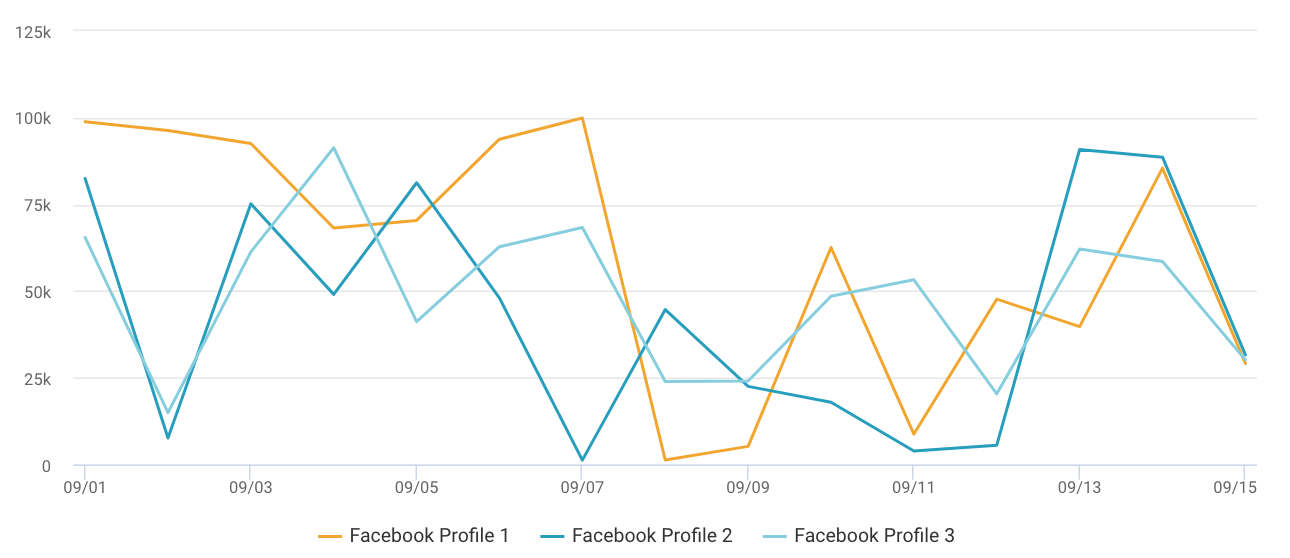
Fans Change
Seeing the number of your Facebook fans increase or decrease is one way of knowing if you are doing well on your social media platform. But just checking the fan count isn’t going to explain any sudden changes. This metric is ideal for analyzing fluctuations in your Facebook fan count, but it can also help you pinpoint exactly when a change took place and to compare your data to other Facebook profiles. By using this metric, you’ll be able to create content that helps you increase your fan count because it’ll help you figure out what content works best for your fans.
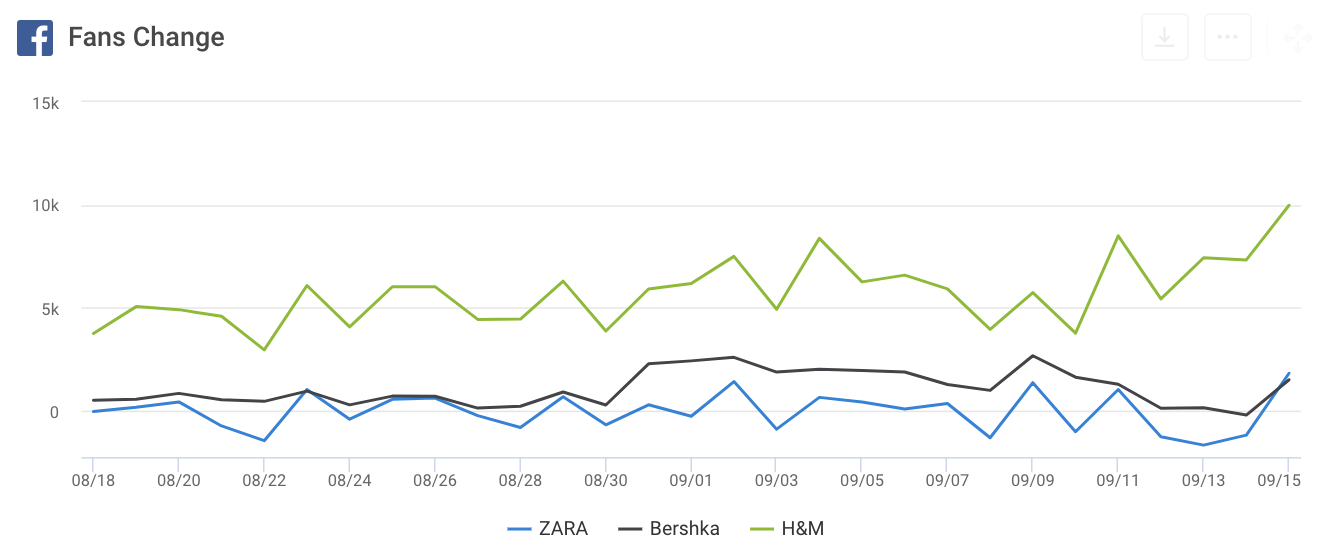
As can be seen in the metric above, Zara has been losing fans on certain days; on 09/13 there was a drop of 1,676 fans. With this information, the company can go to their Facebook page and see what may have caused the decrease. Besides this, it can also be helpful in researching additional information that might uncover further external reasons for any negative (or positive) effects.
Zara could also take a look at the Own Posts metric, which would then show them that there was no content posted on that day. With this information, Zara can look at posts from the day(s) before to see if they received any negative interactions which may have caused the drop in fans.
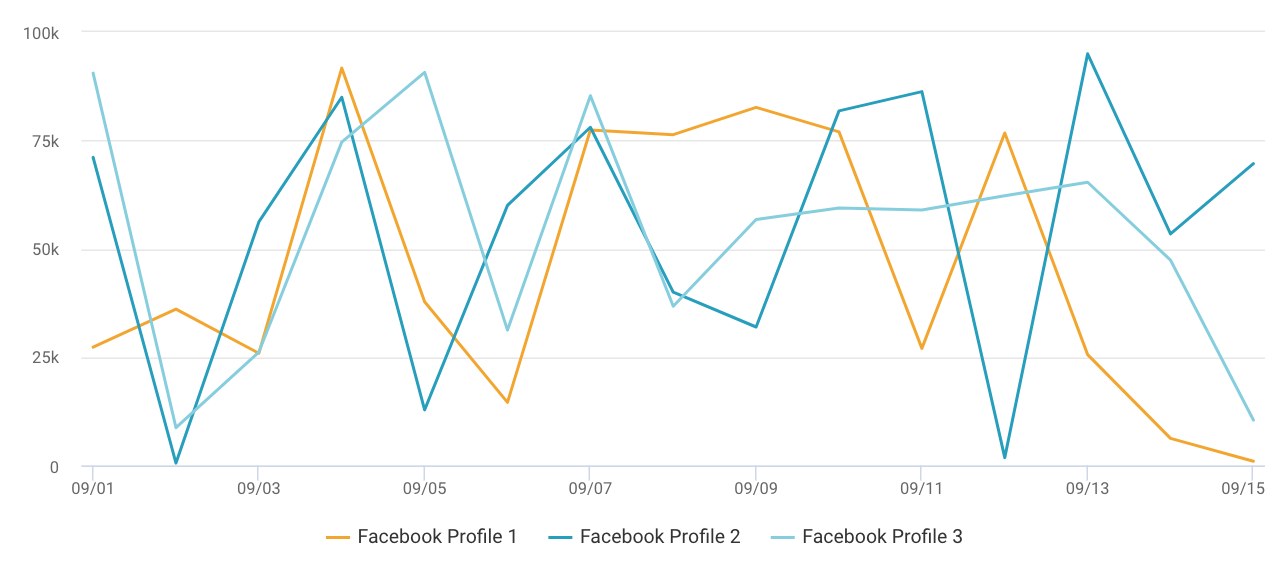
Own Posts
Just posting whenever you feel it’s necessary might not be the way to go when it comes to managing your Facebook account. Many believe that less is more and that 1-2 posts a day are plenty to reach the wanted interactions from your fans. Own Posts helps you gain insight into your posting behavior, such as on what dates you posted and how many posts you created on that day. The metric can also help you figure out if you post regularly on the platform. On top of all that, you can use it to compare your own posting behavior to that of others.
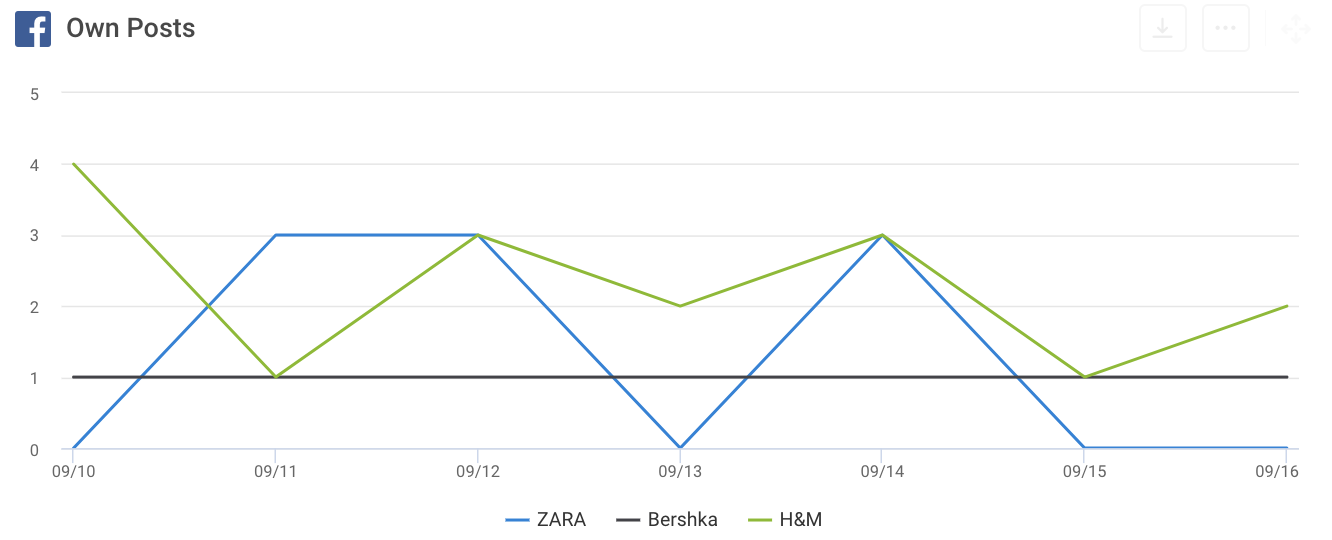
What can be derived from the data above is that Bershka is the only company that is consistent in the amount of content they post; one post per day. The other companies post very inconsistently, with both often choosing to post 3 times in one day, which is more than the recommended 1-2 posts per day. On some days, Zara even decides to not post anything at all, which is not smart as fans are expecting to see fresh content at least once every 24 hours.
Post Type Distribution Per Profile
When posting content on your Facebook page, it’s very important to know which content gets the highest number of interactions. In a previous article about the perfect social media post, we spoke about what the best social media post is. On Facebook, visual content receives a lot more interactions than just plain text, with Facebook videos being the dominant player in the field. To get a clear overview of the type of content you post the most, this metric is ideal. It can also be used to get a good insight into the tactics being applied by other Facebook profiles.
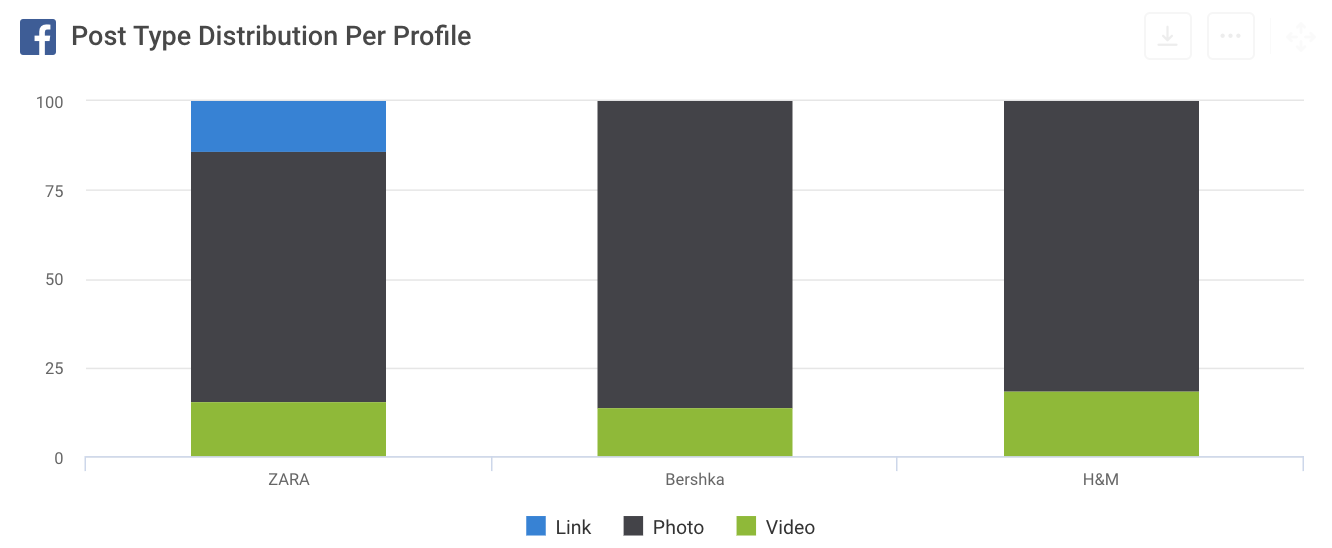
Looking at the data in the bar graph above, it is clear that all 3 companies mostly post visual content, with photos being the most favored type. Compared to the number of photos each company posts, videos are quite rare. If you’re posting the content for your company, it might often feel as though you’re posting a lot of a certain type of content, but this might not always be the truth.
Interaction Rate
As a company, it can be easy to stick to posting the same kind of content. This isn’t the way to go, as it may only succeed in boring your fans. A way to prevent this from happening is to keep track of which posts interest your fans the most and create new content similar to them. By using the Interaction Rate metric, you get a transparent overview of which posts got the most interactions on what day. The interactions are connected to the post, so even if they’re generated on a later date they’re still added onto the Interaction Rate on the original date. To make this metric easier to use for comparisons between multiple Facebook profiles, we do not show the actual number of interactions the posts have received. Instead, we show the rates as a normalized number; the amount of interactions divided by the number of posts created in the selected time frame, and then divided again by the page’s Fans.
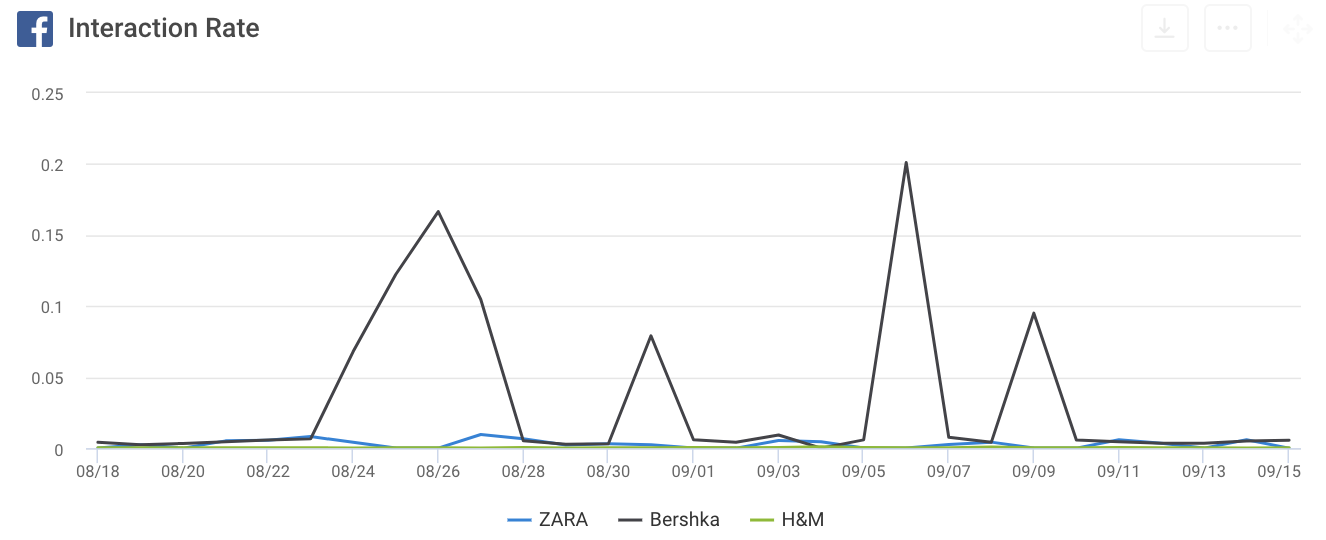
Bershka’s fan count of 11 Million is far smaller than Zara’s (26M) and H&M’s (35M), but is performing way better in the Interaction Rate. The company is able to trace this data back to the actual posts and fit their newer content with the ones that received the most interactions.
Reach
It is nice to see how many likes a post gets, but this in no way represents the number of people who have actually seen your content as plenty of people view content without further interactions. Using the Reach metric will help you see how many users have been reached by your content. This number includes ads, sponsored stories, and dark posts. It may become clear that a lot more people are interested in your content than you had thought and other Facebook profiles may reach fewer people as imagined from the number of interactions on their posts. Only ‘unique users’ are counted for this metric, meaning if a person visits the same page twice, no matter how they came back to it, their visit will only be counted once.
Another metric similar to the Reach metric is the Impressions metric. This metric actually works the other way around, meaning that it counts how many times your content has been seen by users. Using the Impressions metric, you can discover exactly how many times people have visited your content. Unlike the Reach metric, the Impressions metric counts every visit of the users, no matter how often they come back to the content. So it’s always at least as high as your reach.
Conclusion
Making use of these KPIs will help you to get a better understanding of how your company is performing. If you have access to such information, it becomes much easier to adjust your content to your users' preferences. It is still important to figure out your company’s own KPIs, but the ones I have talked about above will give you a good base for improving your social media game.
Please always remember that the KPIs which you choose for your analysis should represent your very own goals. Accordingly, the metrics presented here can be seen as a first inspiration. It’s our philosophy here at quintly that there is no ‘one-size-fits-all’ approach to social media analytics, so always keep in mind that the perfect set of social media KPIs can only be identified on a case-by-case basis. Of course, we’re always here to help you find the right KPIs for you.
We’re only one tweet or Facebook message away and you can also find us on LinkedIn.
Recommended Readings
How to Analyze Your Facebook Performance

Join the conversation. Leave us a comment below!