
Here at quintly we have gone through a lot of iterations on defining different metrics and helping our clients to integrate these in their overall social media strategy. And from what we know from our clients, it becomes more and more important to be able to adjust the metrics according to the specific needs. E.g. for one client the definition of our Interaction Rate is perfect, but another client may need different weights or even skip certain parts of the formula. This is why today we are launching the biggest and technically most challenging feature in our history, QQL.
QQL stands for quintly query language and gives you the power to define your own metrics based on the quintly data pool. As you can hear from the name this is based on the SQL language, technically based on SQLite. You have not noticed it yet, but all the metrics that you currently use in our tool are already running on QQL internally for the last few weeks. Now we want to take the next step and give the same power to you in order to create the metrics you care most about.
The QQL Console: Define Your Own Metrics
When you want to go beyond existing metrics and define your own, you can use the QQL Console to do so. The easiest way is to start with an already existing metric and go from there. In the help section for each of the metrics (click the little question mark you find next to each metric) you can find a “Open in QQL Console” link that loads the information into the QQL Console. From there you can adjust the query, load in additional data sources and decide on the visualization type (line chart, column chart, table, etc.). Once you are done, just hit “Run” and you will see the resulting output.

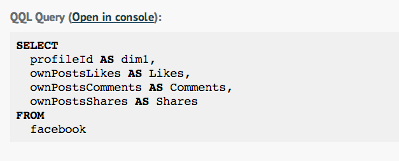
An example: The Interaction Rate
Lets take a look at the Interaction Rate as an example. The following QQL query is behind this metric:
SELECT profileId AS dim1, time AS dim2, ((((ownPostsLikes+ownPostsComments+ownPostsShares*1.0)/ownPosts)/((fansBefore+fans)/2))*100) FROM facebook
As you can see, this includes the full formula. If you now would like to leave out the comments or introduce different weights, you can easily do so by adjusting the formula. Even better: You can write completely new metrics using this approach.
The Big Picture: The First Social Media Analytics Query Language
The launch of the QQL Console today is just the first step in a row of updates we will be rolling out over the next weeks. You can expect support for saving custom metrics in order to use them on your dashboards, a lot of documentation on how to write your own metrics, further data sources and much more.
We would be happy to work with you on integrating these new possibilities into your daily routines. Feel free to reach out to us in order to give the QQL Console a try and we will take the time to go over this with you in more detail. Starting today, all Business L clients will be able to use QQL from within their accounts.
We are really curious to hear your feedback on this! Let us know what you think.

Join the conversation. Leave us a comment below!