
Last week I gave a talk at the AllFacebook Marketing Conference in Berlin about how brands are using the different social networks and where they are present. This blog post is a summary of the findings we gathered. As we have a lot of data at quintly about how brands and users in general analyze their social media profiles we have a very good base for looking at some general underlying trends we see across our whole user base.
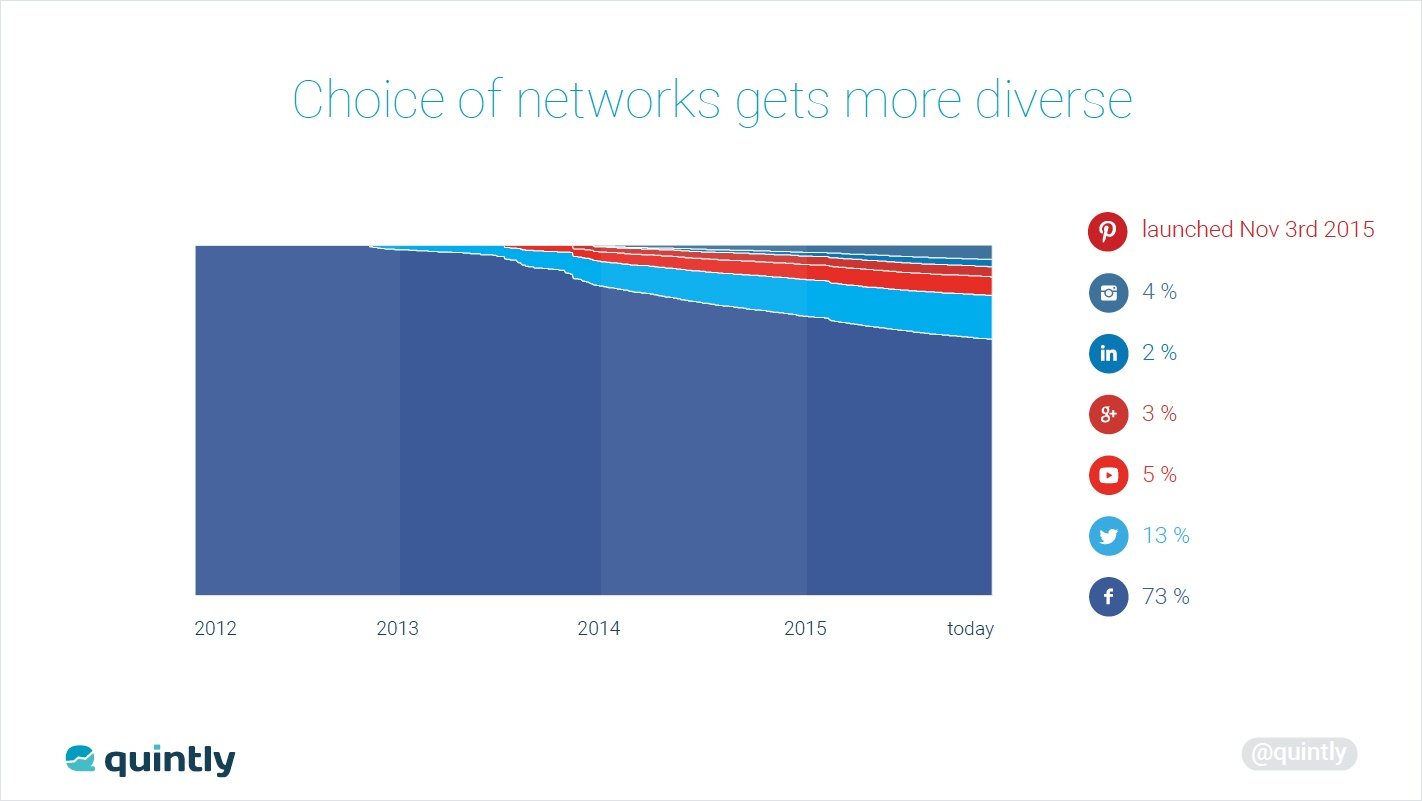
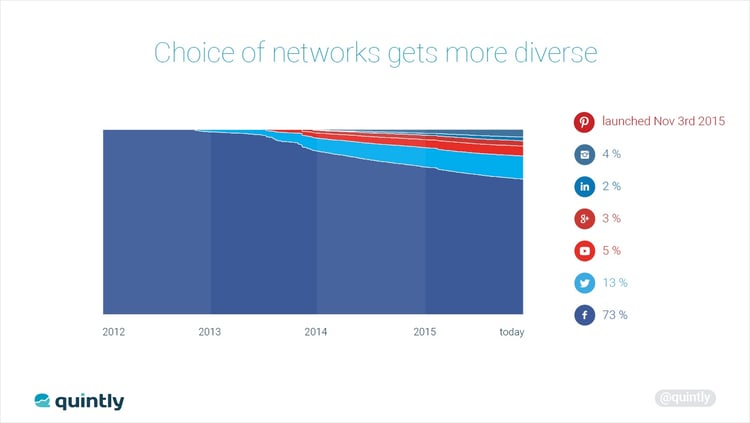
The first thing we saw is that users put more focus on more networks. When we started quintly in 2010 we only offered Facebook analytics, but as we are up to 8 networks nowadays, it’s very interesting to see how the different networks are tracked. When we launch new networks within our tool we usually see an increased adoption in the first months and then things keep growing with the normal usage. When we look at all the profiles that are tracked with quintly at the moment, Facebook is still taking the lead with roughly 73% of all profiles added. Twitter, as the second most analyzed network makes it to 13%. The remaining positions are YouTube (5%), Instagram (4%), Google+ (3%) and LinkedIn (2%). As we just launched Pinterest analytics, the numbers are not yet included here.
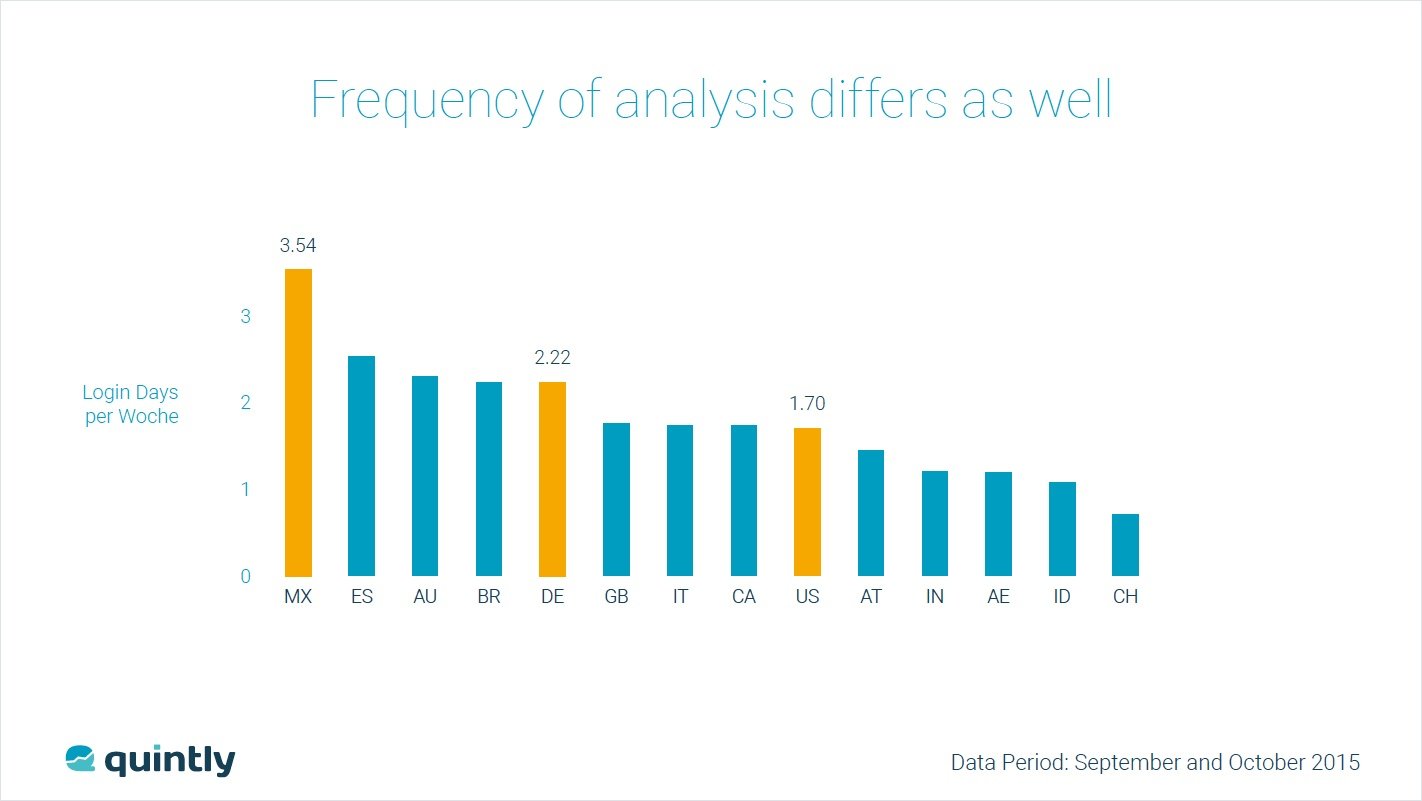
As the second step we wanted to understand how often companies and users from the specific countries are analyzing their social media efforts. Therefore we looked at the average number of days per week that users login to quintly within the months of September and October 2015.
Here you can find the full presentation that I gave in Berlin last week:
If you have questions about the things discussed or want to get deeper into the data, feel free to send us a mail or just tweet to us.

Join the conversation. Leave us a comment below!