
quintly now supports all Facebook Insights Video Metrics
Facebook videos receive higher engagement than images and other content, hence they get increasingly important for marketers. Due to this importance, Facebook now offers some new API endpoints which we used to release a bunch of new Facebook video metrics for page owners. Through these metrics, videos and interactions on those are more measurable than ever before.
The presented Facebook video metrics will help businesses to analyze how people react to their video posts and even help them to publish and promote their videos more successfully.
In the following you will get a look at some of our new metrics:
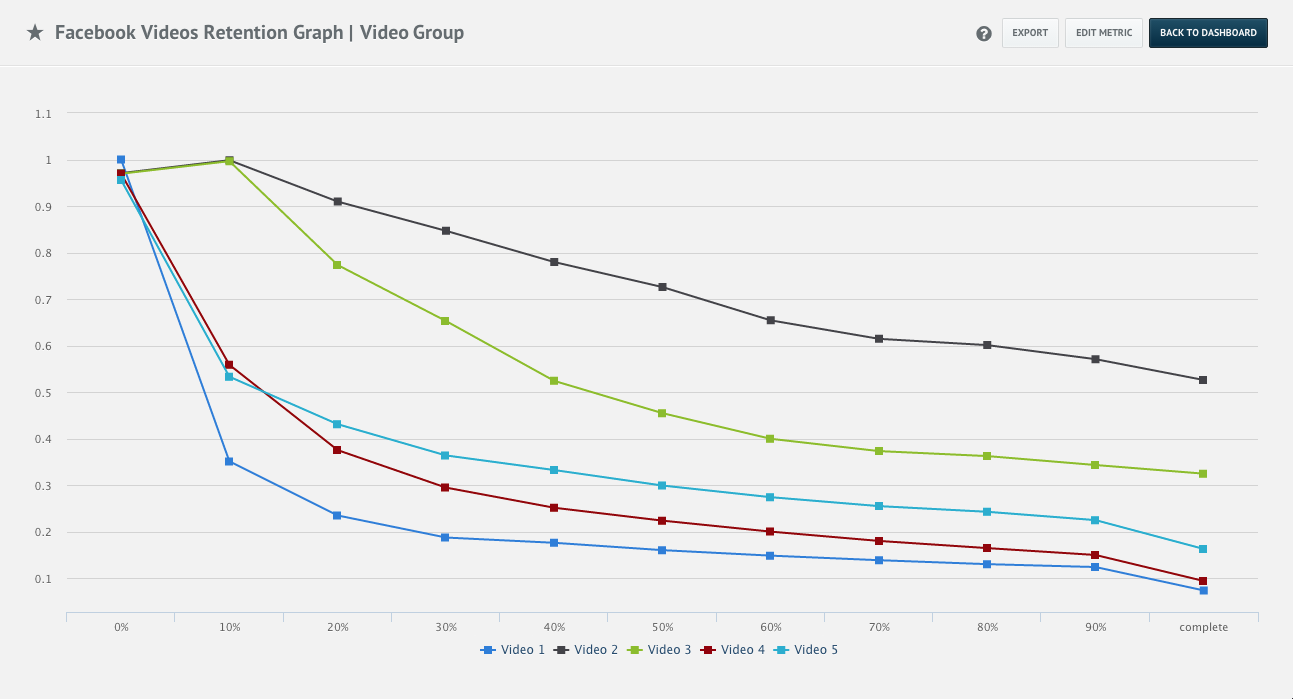
Audience Retention
The Audience Retention Graph shows the percentage of all views at each second in the video, called interval here.
With the Audience Retention Graph you are able to identify if a video attracts the attention of its viewers or if the viewers are quickly losing interest in watching the video. Interest over time is a good indicator of how the content of your video is perceived. This might help you to identify certain characteristics in your videos that drive interactions and check which of them seem to be less engaging. Similar to a TV spot you always try to keep the interest of the viewers as high as possible, so that the relation between the brand and the user lasts as long as possible.
Besides the Audience Retention Graph there are several other new metrics. We can now differentiate between video views, repeat video views, autoplayed video views and click-to-play video views. However, these numbers are only available on a page level yet. Facebook is probably going to launch the same metrics on a post level soon.
Facebook Repeat Video Views
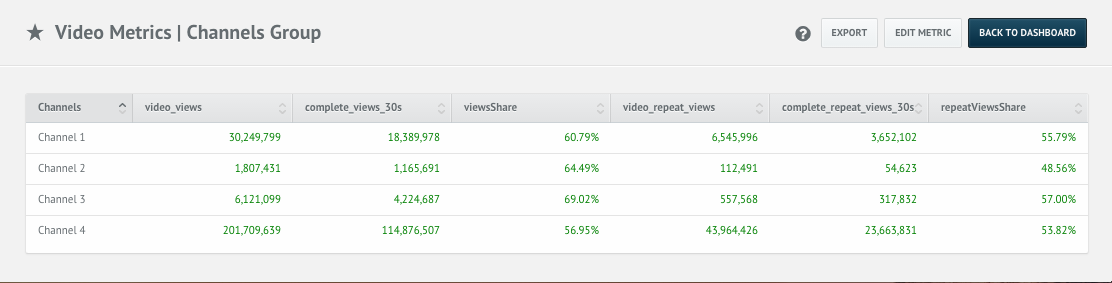
If a user watches your video more than once it is considered as a repeat view. Repeat views is a valuable metric as it indicates a high connection of consumer and content. Especially for brands it is ideal to aim for a high share of repeat views as this indicates a high level of interest in the content provided and brands are able to tell their story and leave the anchor in the consumer's brain.
Facebook click-to-play vs. auto-play
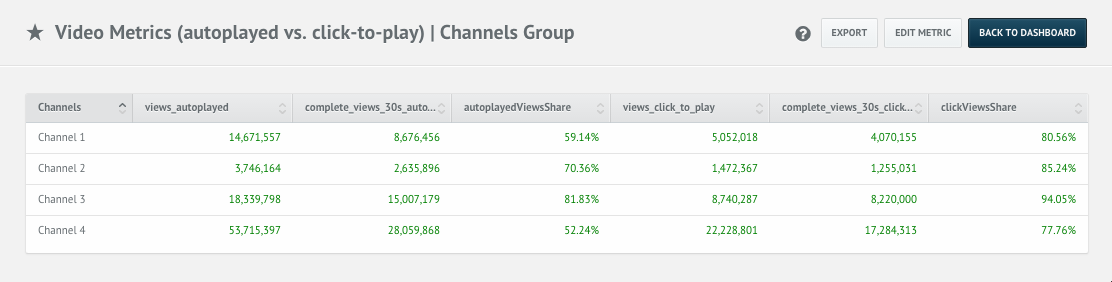
In May 2014 Facebook announced the international launch of autoplay video ads. Since then users can decide whether videos should start automatically once they show up in our timeline or if we want to click to play the video. The table above compares the autoplay views with the click to play views.
You can see that share of clicked to play views, which lasts over 30 seconds are by far higher than the share of the autoplayed views which lasts over 30 seconds.
In general you can say that autoplayed Facebook videos are getting less longer views than videos that were intentionally clicked to play. Users that clicked on a video to play it have a way stronger acceptance for the shown video content. This leads to the fact that the ratio between the “views_autoplayed” and “views_click_to_play” should be rather high.
There are lots of useful Facebook video metrics you can build using the new Facebook video endpoints. With quintly’s own query language (QQL) you are able to create almost every metric you want. You could as well calculate autoplay/click-to-play ratios to see directly if most of your viewer click to play the videos or watch them autoplayed. If you need help building a metric, we are just one mail or tweet away.
Through the metrics delivered, we enable brands to measure their most essential asset - their message. The social web brings many possibilities and it brings even more if things get measurable and back up marketing decisions in the end. A video is nice to have but to know which seconds work best, differentiates the leaders in the industry to the average. Stay ahead of your competition and give those facebook metrics a try.

Join the conversation. Leave us a comment below!