
Besides using our tool directly, there are several use cases where it makes a lot of sense to integrate our data into existing dashboard solutions like Klipfolio and Geckoboard. This is especially helpful if you want to create dashboards and reports across different disciplines, e.g. combining website analytics, your own sales numbers and social media data. By using our API you can easily integrate quintly data into other services. In this article we want to show step by step how to integrate our data into Klipfolio, a very well-known dashboard solution.
1) First things first: Access to our API
Before being able to integrate with other services, you need access to our API. All paid packages automatically get access. Anyhow, additionally you need to ask our support team to provide your personal Client ID and API Secret. These will then be used to authenticate via basic auth later on (see our API documentation for more details). Basically you can then ask for any data point we also provide within the tool. And even better, you can use QQL queries to exactly fetch the data points you are looking for.
2) Access to Klipfolio
Well, this one is obvious: You need access to Klipfolio :-) Any of their packages is fine to integrate other providers like us.
3) Set up a new data source for quintly within Klipfolio
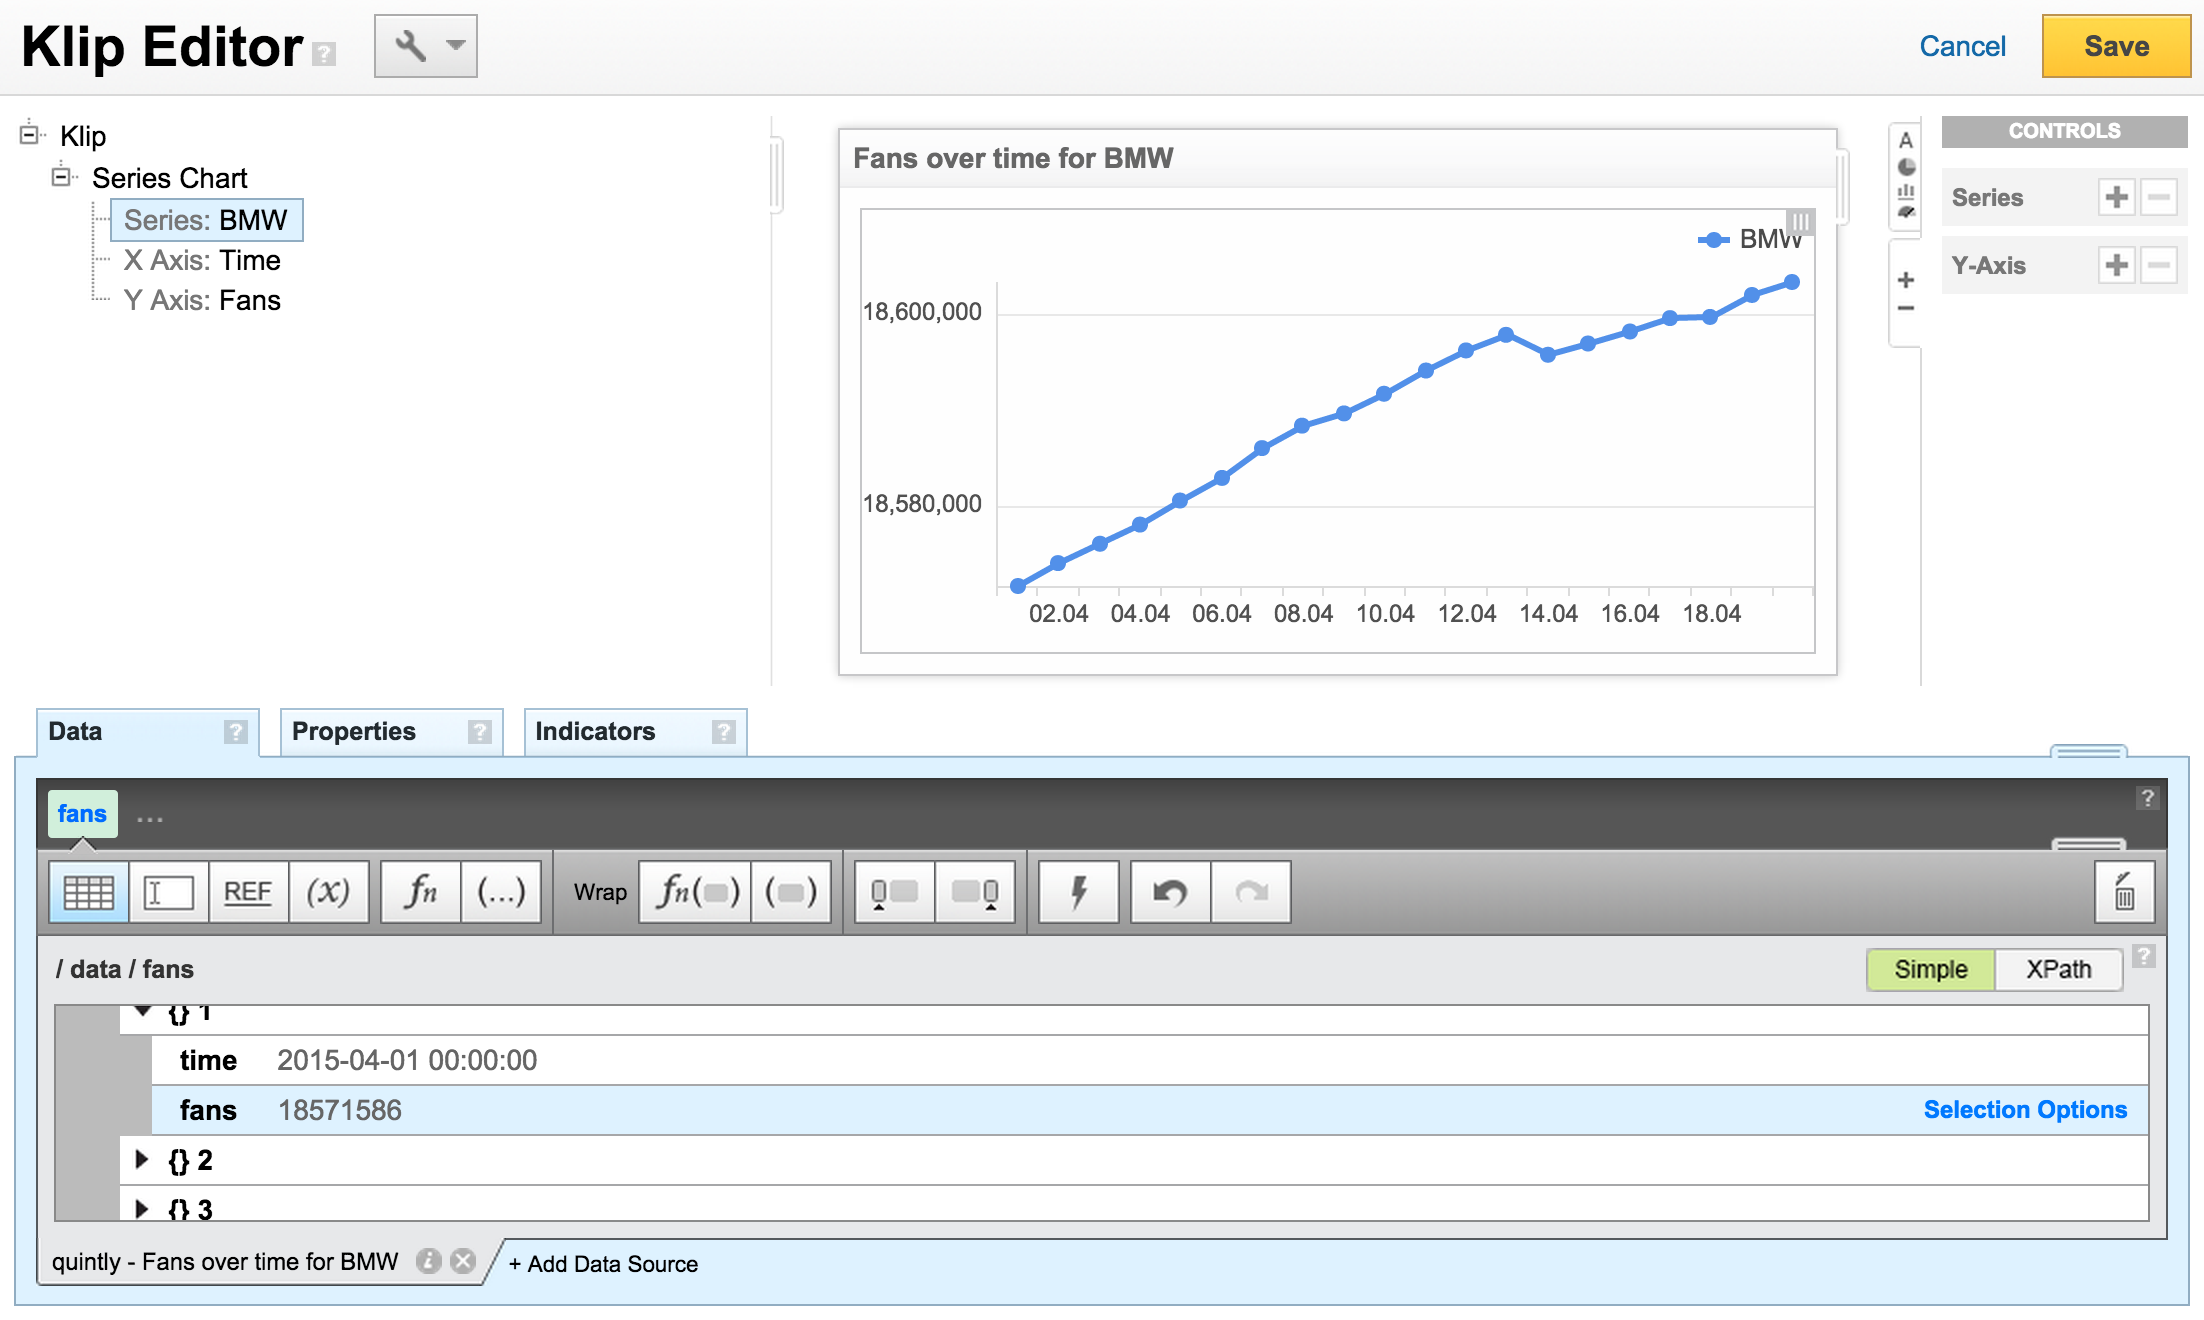
Now lets start integrating. Our goal for this step by step how-to is to show basic fan numbers for BMW within Klipfolio. You will easily see that you can bring in any other number into Klipfolio using the same approach.
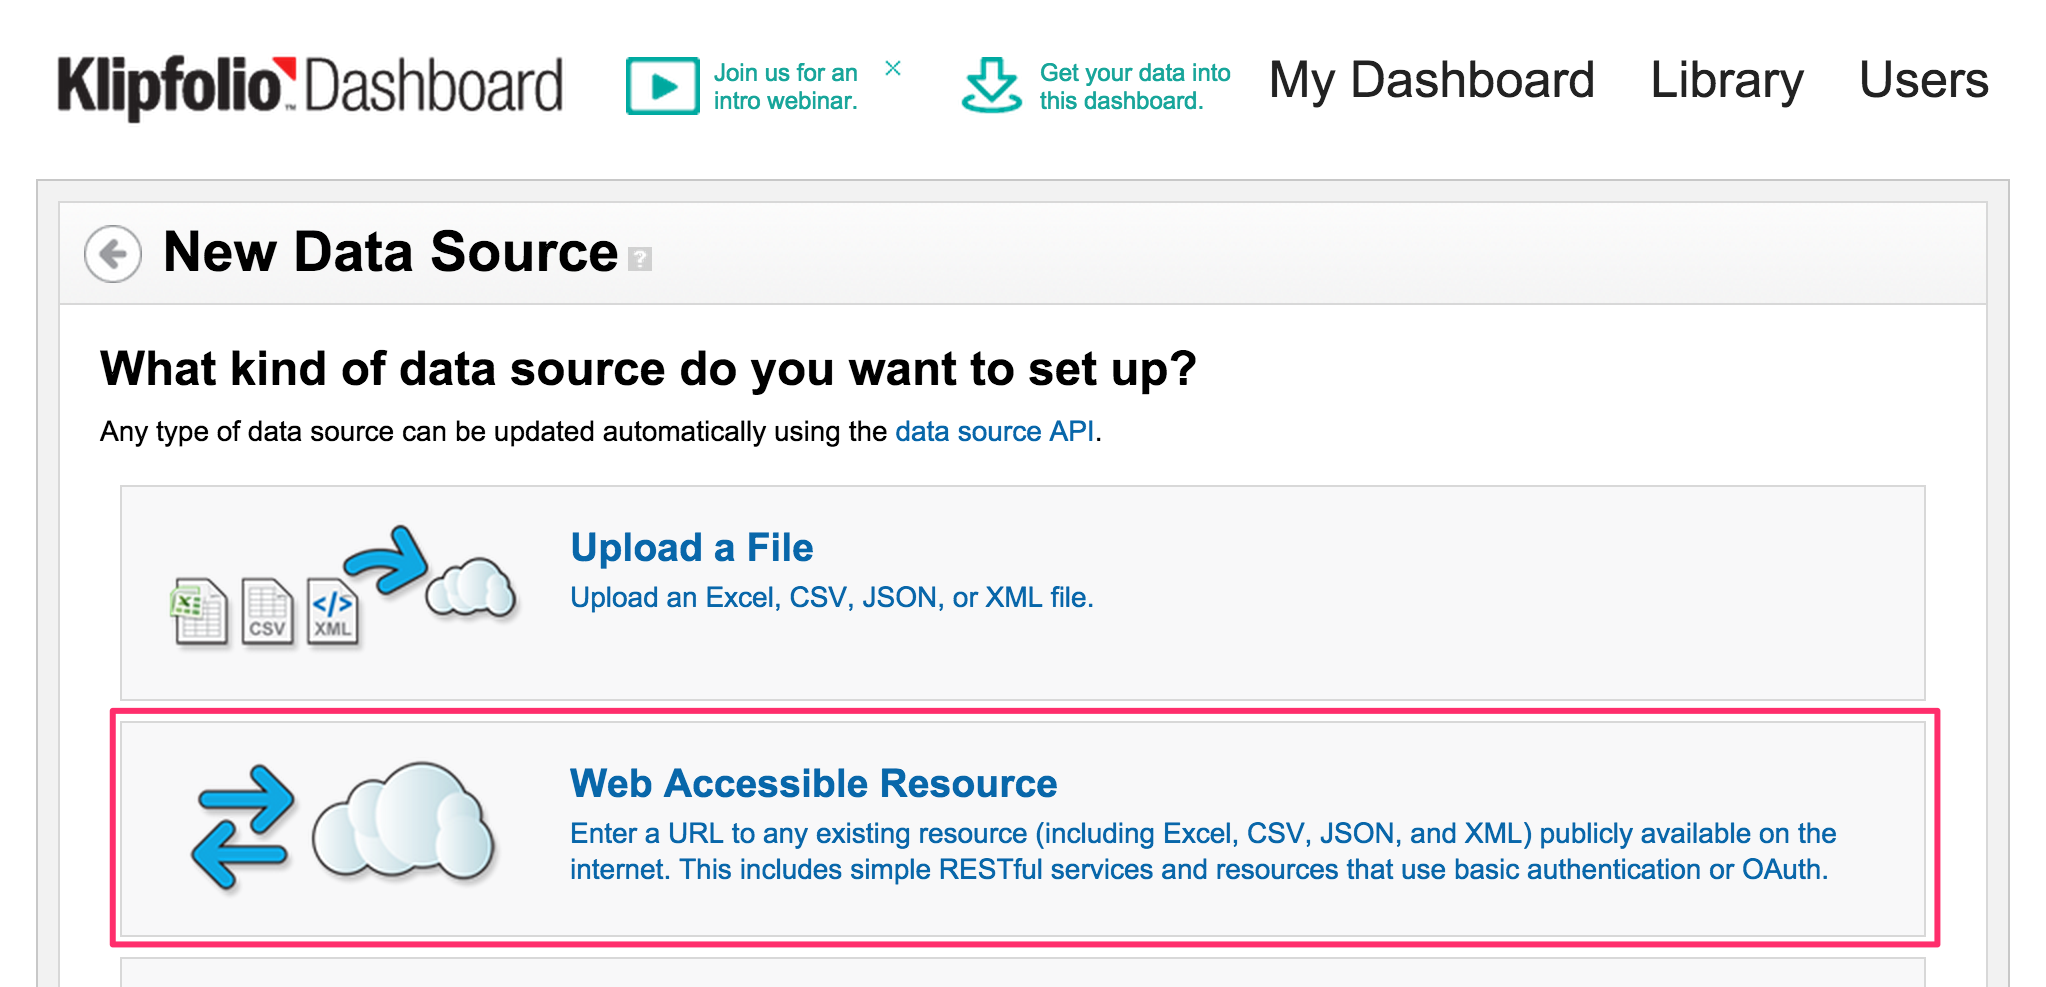
Underneath any metric (called Klip within Klipfolio) there is one or more data source providing the data to be shown. Once logged into your Klipfolio account, you simply need to go for Library > Data Sources and click Create a New Data Source. The following options will show up:
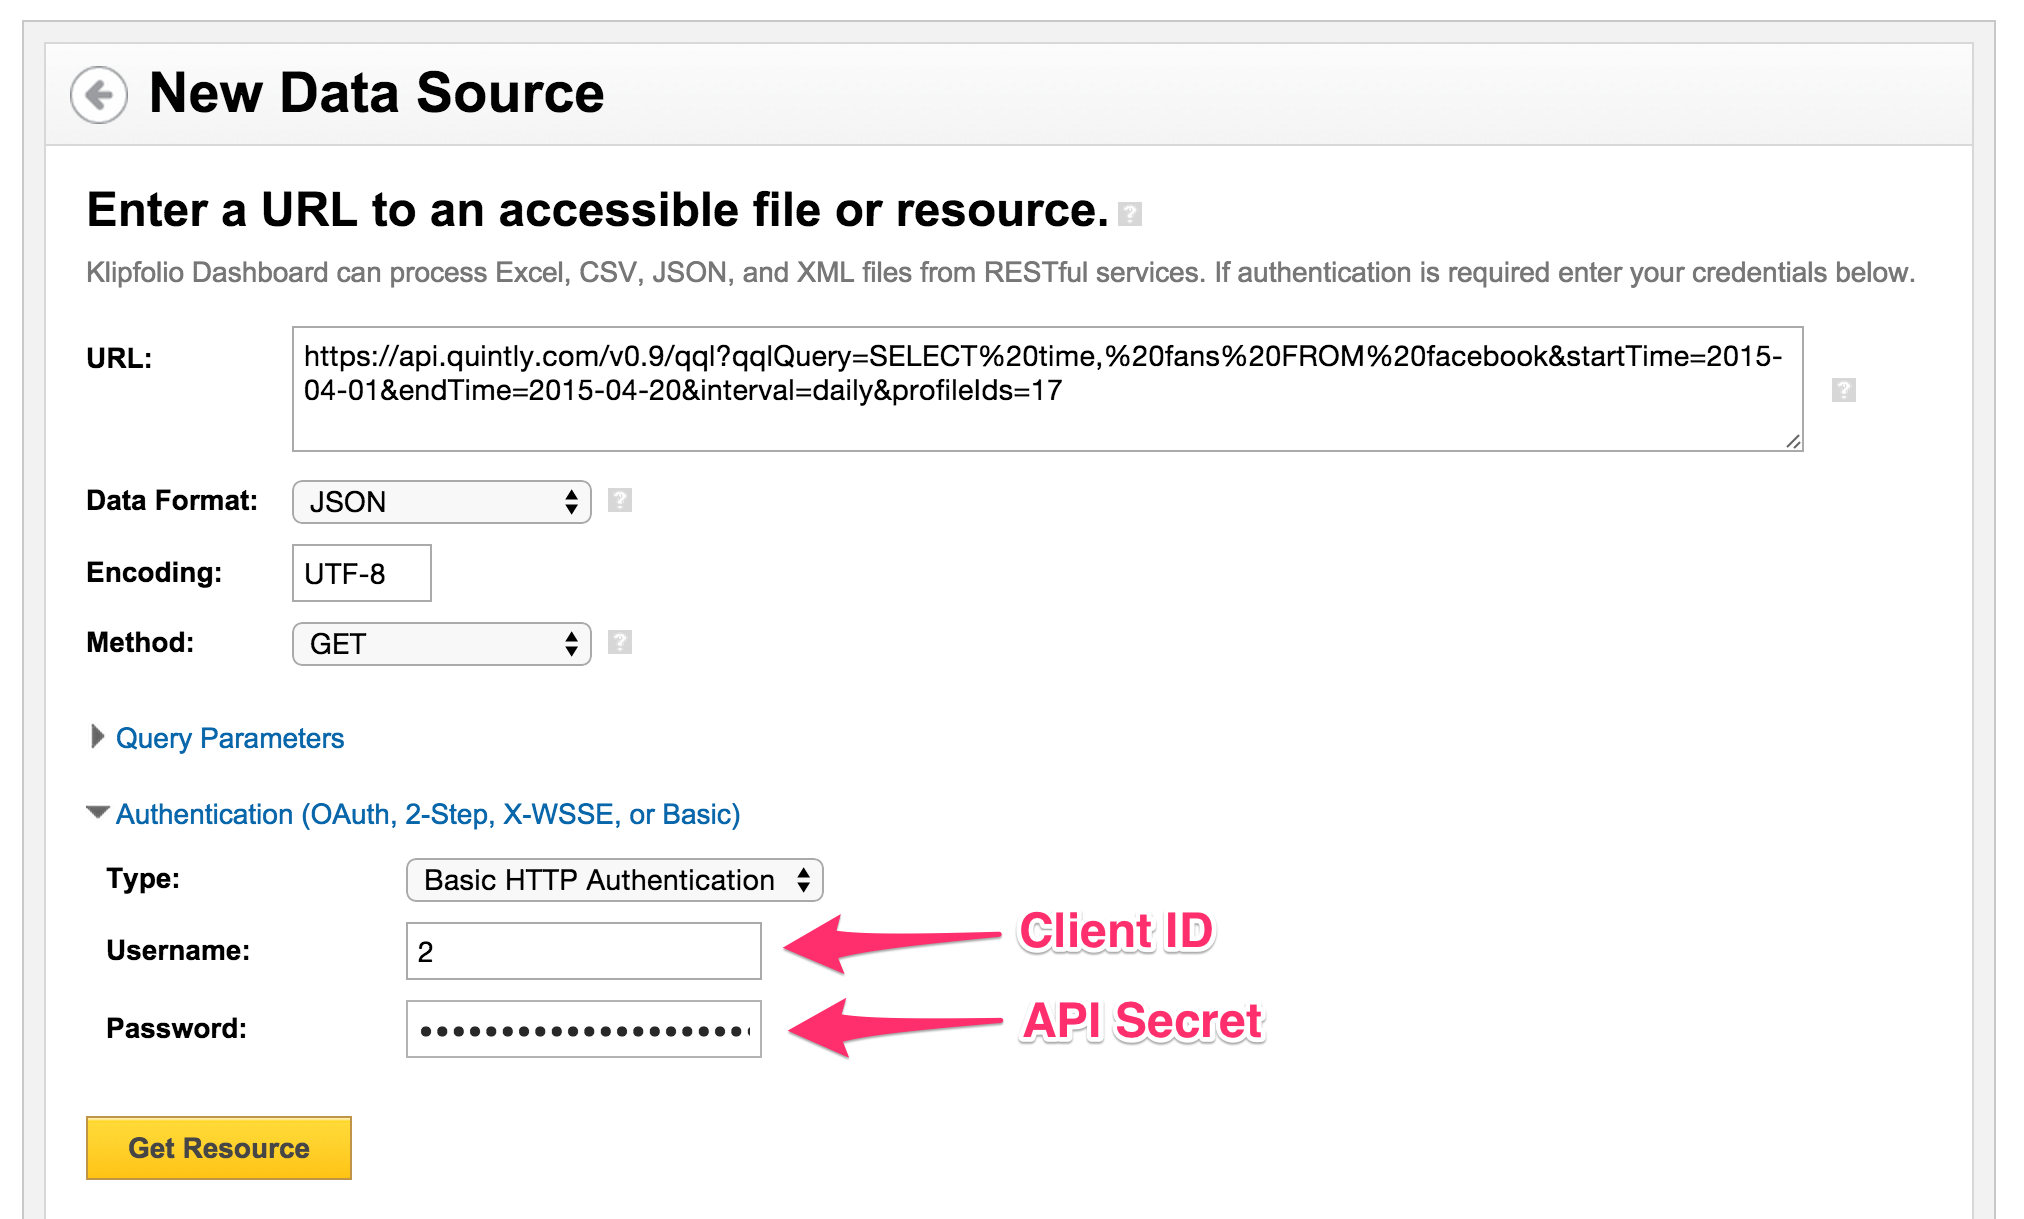
Let's start with authentication first. We choose Basic HTTP Authentication and set the Client ID and API Secret provided by our support team as username and password. No additional Query Parameters need to be set. The URL is now specifying what data should be loaded from our API:
https://api.quintly.com/v0.9/qql?qqlQuery=SELECT%20time,%20fans%20
FROM%20facebook&startTime=2015-04-01&endTime=2015-04-20&interval=daily&profileIds=17
The qqlQuery is specifying what data points need to be loaded. The profileIds, interval, startTime and endTime parameters provide the context for what profile and which time period and interval to fetch data for. In our example we are loading data for profile BMW, April 1st to 20th 2015, aggregated by day. Just to mention, a Profile ID in this case is the quintly ID for this specific profile. You can check the ID for specific profiles by calling the https://api.quintly.com/v0.9/list-profiles endpoint within your browser and providing Client ID and API Secret as username and password. It will list all profiles added to your quintly account with their ID. You can find further information on building QQL queries and how to use our API in general here and here.
There are even more options to set up a data source in a more flexible way, e.g. by setting relative startTime and endTime parameters by using Klipfolio’s date expressions. This way you can avoid adjusting your data source too often and instead always ask for data of the last 30 days.
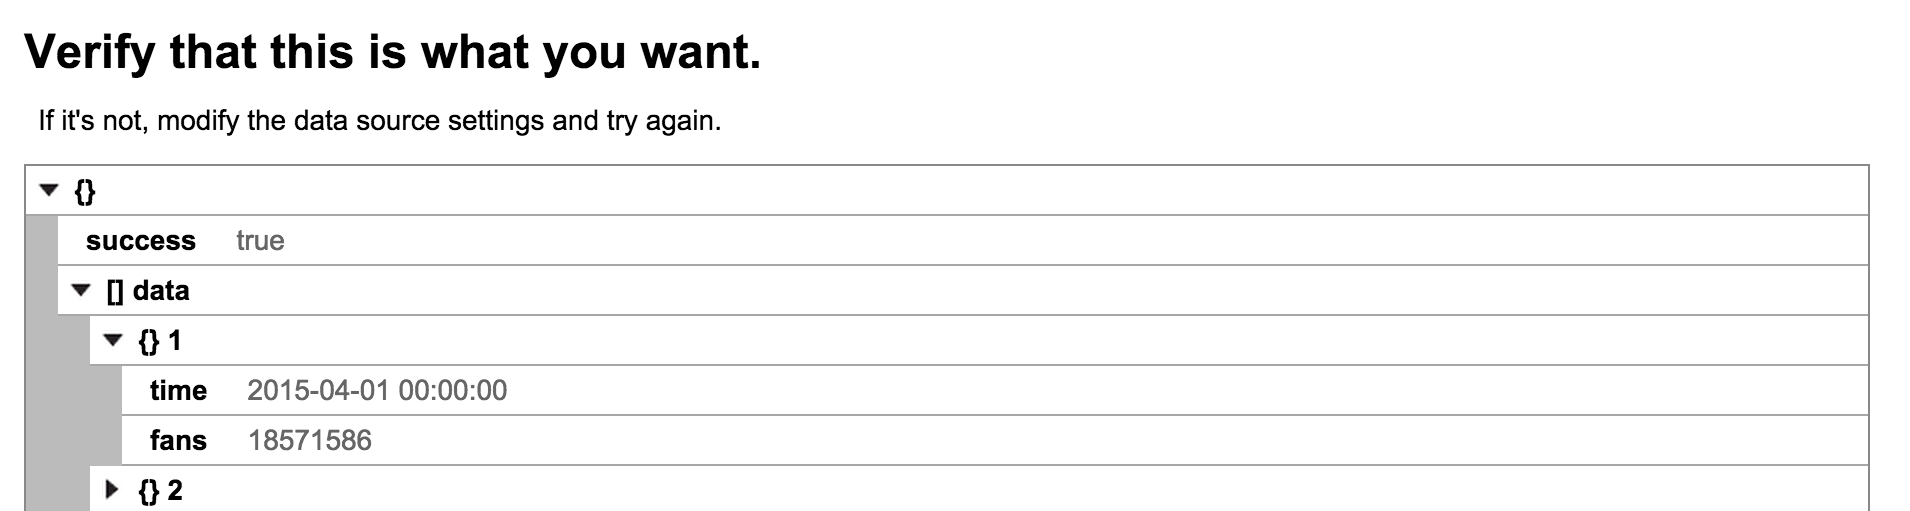
Next Klipfolio will ask you to verify if the API response is what you expect. If everything is alright, it will look like:
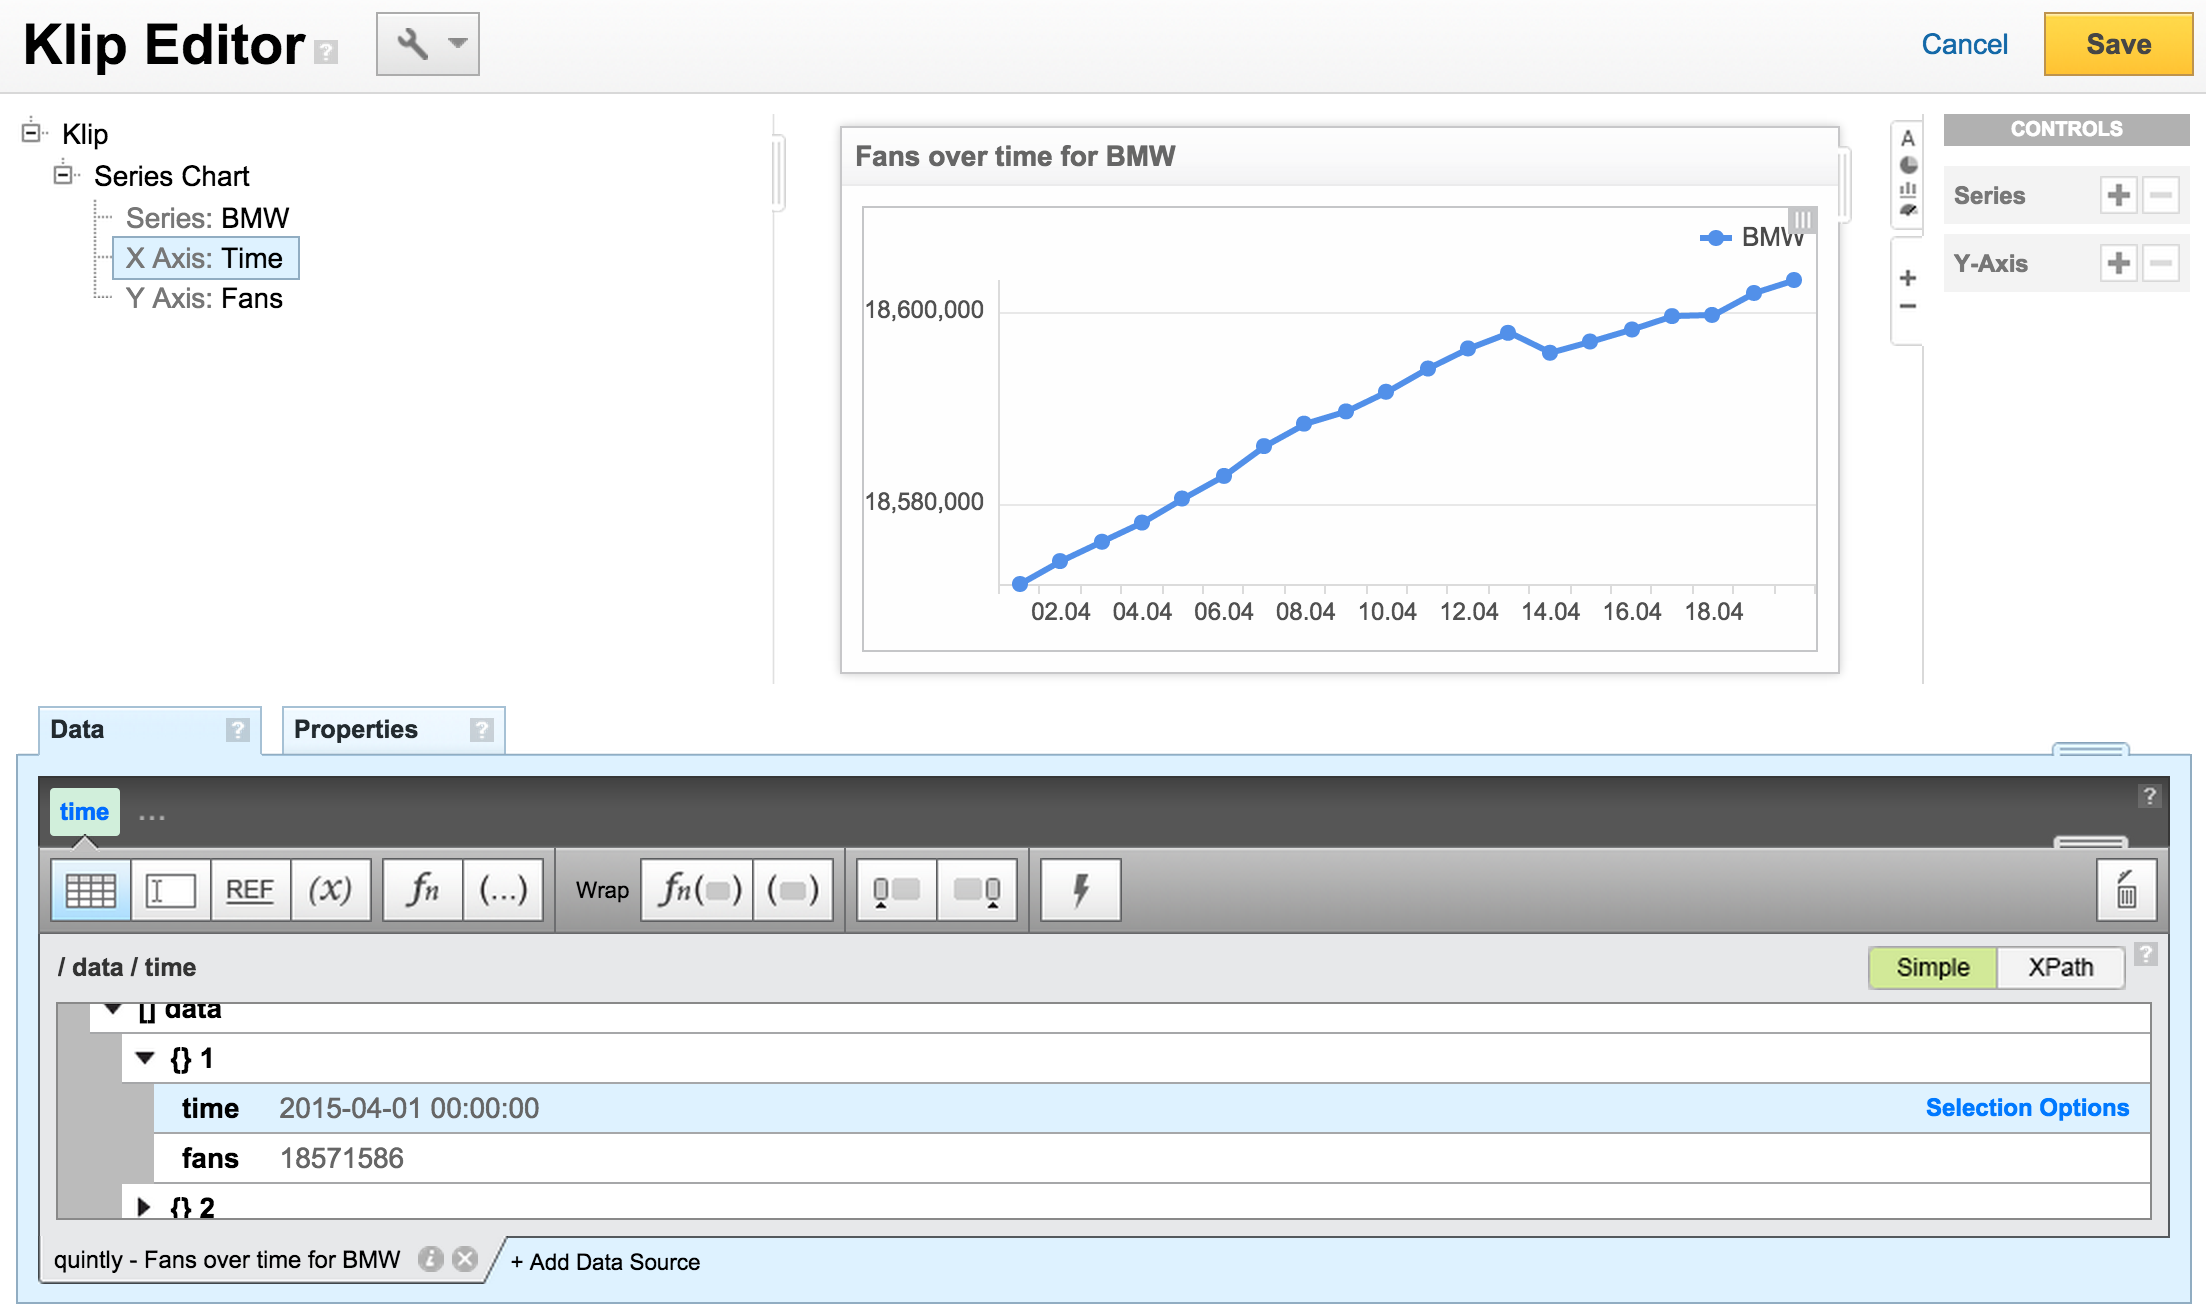
4) Create a new metric/Klip based on our new data source
We just finished creating our new data source within Klipfolio. Next we want to build a line chart using it. Simply go to Library > Klips and click Build a New Klip. We choose Bar/Line Chart, then Use an existing data source from the library. Next choose the data source we just created before. The Klip Editor will be opened:
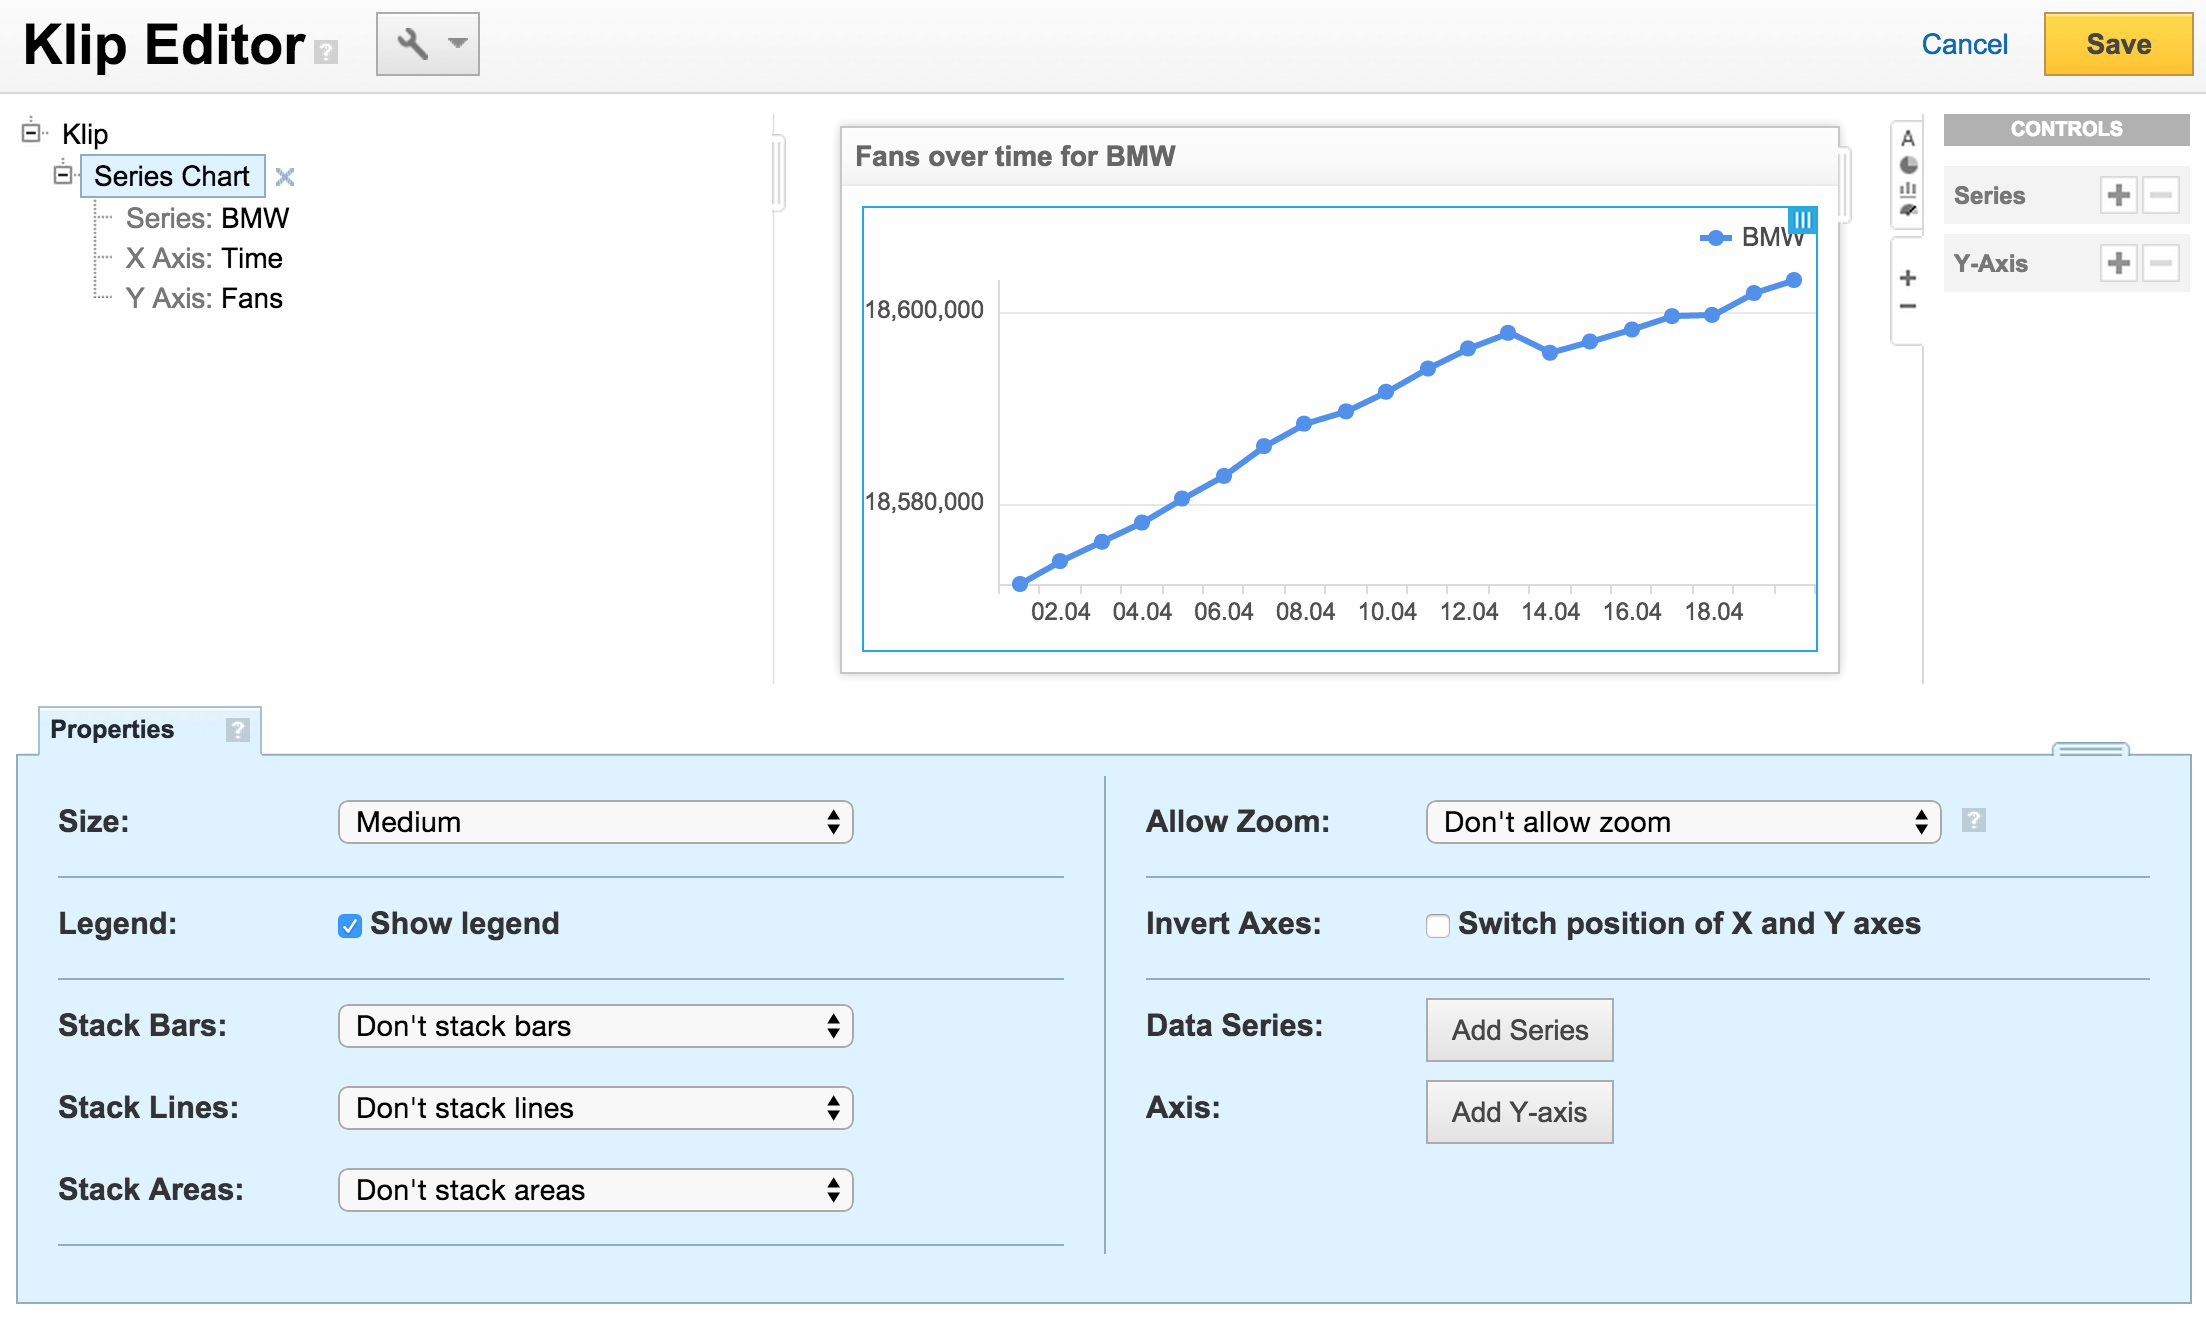
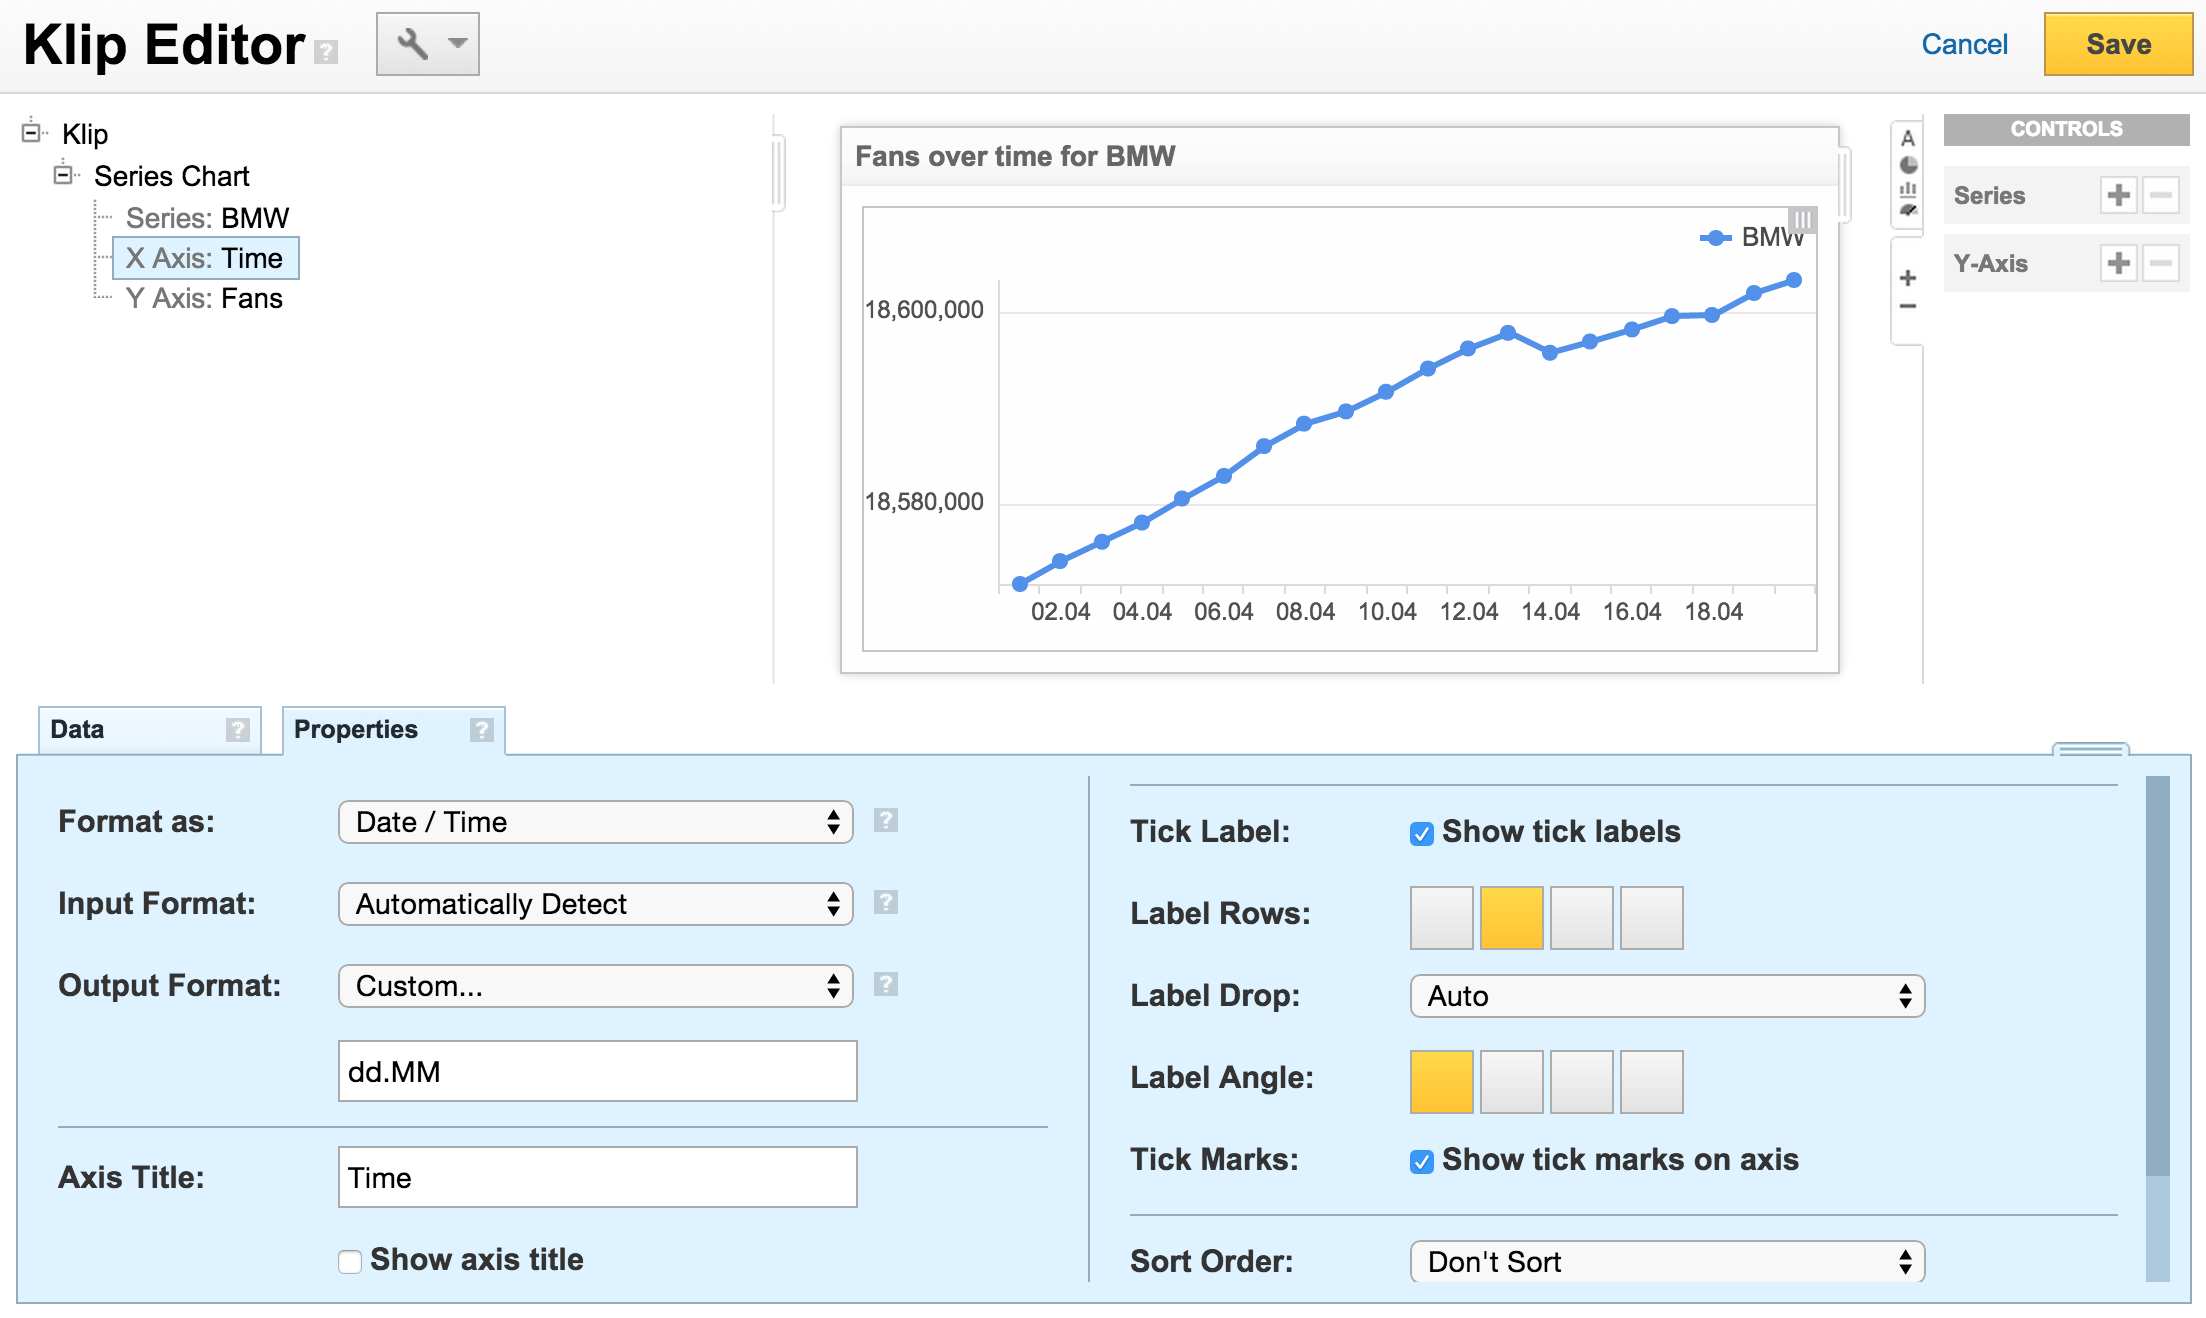
Next we need to specify what to put onto the x axis. Choose the time attribute.
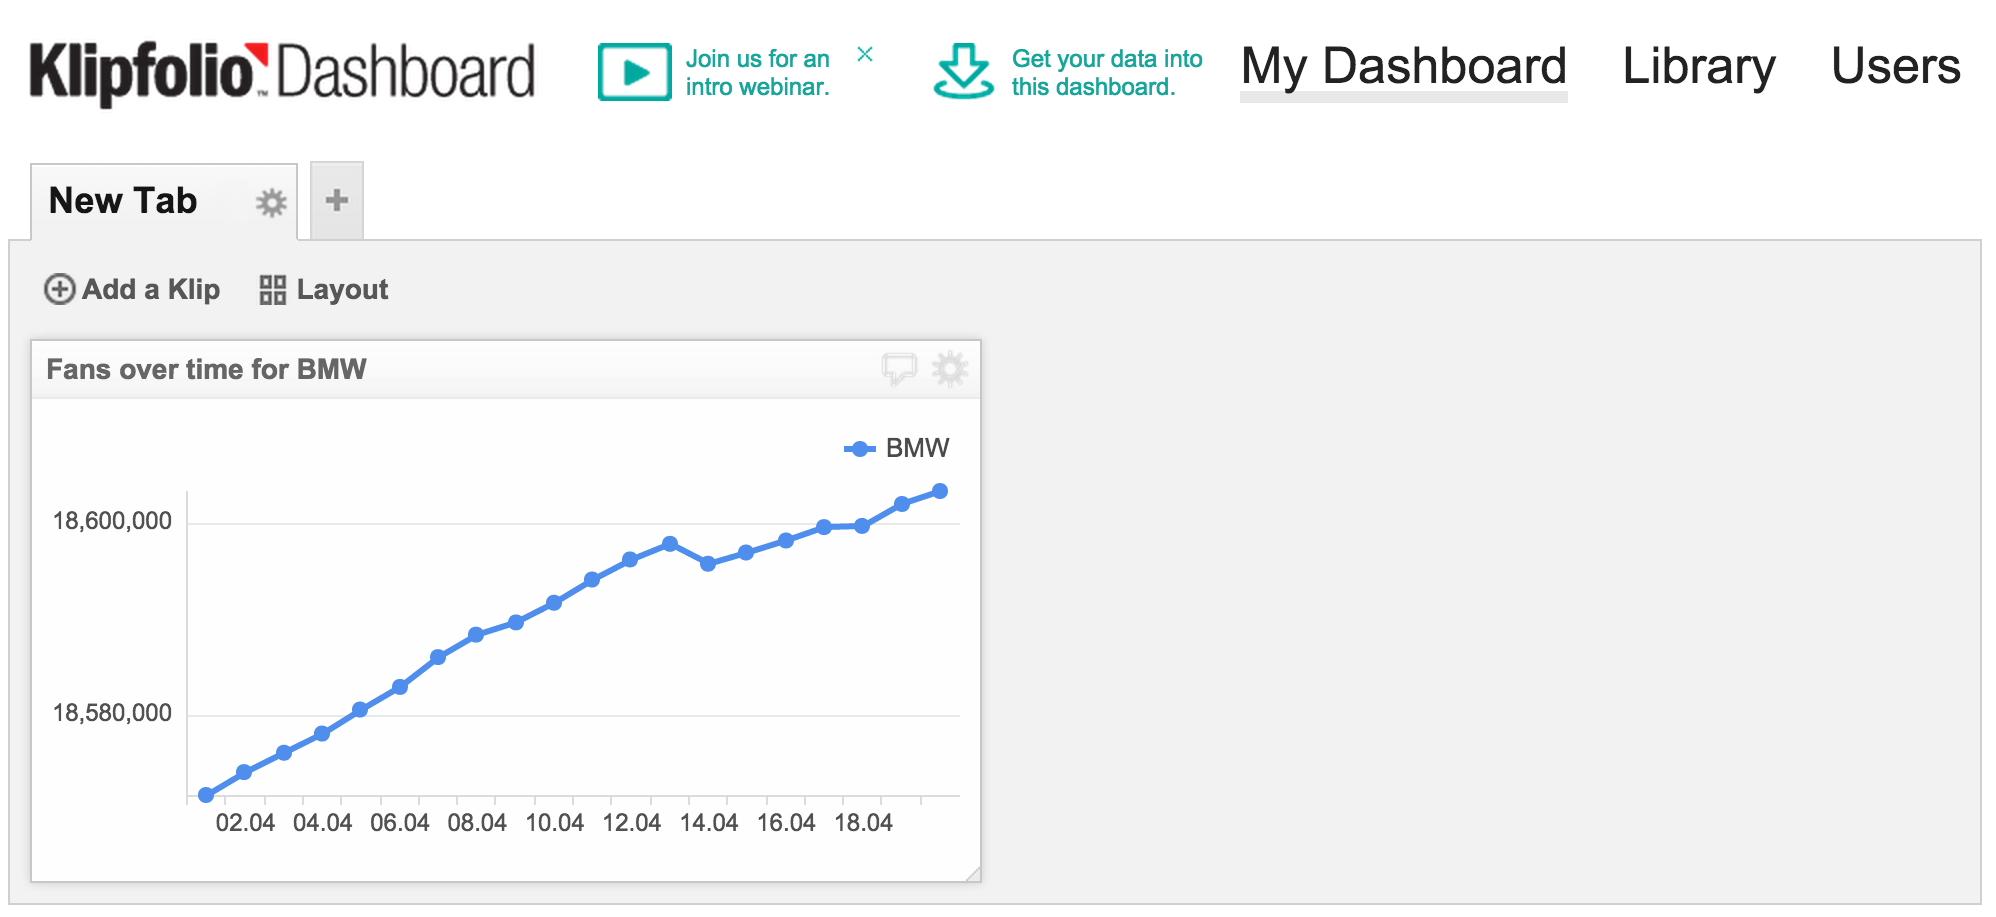
5) Create a dashboard/Tab and add our new metric/Klip
Now let's create a new dashboard/Tab where we would like to put our new metric/Klip. Simply go to My Dashboard and click Add a Blank Tab. A new tab will be created stating You don’t have any Klips on this tab. Click Add a Klip and choose the metric/Klip we just created before.
Tada, here is our first Klipfolio dashboard/Tab showing quintly data:
Further there are lots of ways to make your data sources integrating our API more flexible, e.g. by using Klipfolio’s date expressions and date filter inputs. This will enable you to even switch time periods directly on your Klipfolio dashboard/Tab without the need to change your data sources all the time.
Hopefully this step by step guide helps you to better understand how to integrate our API into existing services like Klipfolio. Please let us know in case of any questions on how to integrate. Our support team is happy to assist you with any questions.
You can also check out our knowledge base or send us a Tweet via @quintlyapp.

Join the conversation. Leave us a comment below!