
This is a guest post from William Johnson, who belongs to the most creative field of digital media: web design! Currently, he is obsessed with the latest trends in e-commerce development, search engine optimization techniques, and social media analytics. William also runs free consultation programs on website technical and usability review, web and UI designing, social media content creation, web analytics and popular internet marketing trends for his reader base. He has been a regular contributor to leading online portals such as SmallBizTrends, SEMRush, Template Monster etc. Connect him at Google+ and Twitter.
‘Video Marketing’ as we all know has become the strongest content marketing weapon for tomorrow’s marketers. The statistics shows that by 2017, video will account for 69% of all consumer internet traffic as researched and presented by Cisco in a White Paper, “Cisco Visual Networking Index: Forecast and Methodology, 2014-2019”.
The research findings clearly indicate that tomorrow’s online marketing strategies would revolve around video creation, video promotion, and strategic analysis of video marketing success or failure. YouTube Analytics, for every reason, is going to have the same popularity and usage as Google Analytics or Google Search Console (previously called Google Webmaster Central) tool has it today to the web analysts and search engine specialists.
The very nature of any analytics tool is to provide resourceful insights on the key performance metrics over a period of time that a business wants to track. It shows the changes in KPIs, either positive or negative in a clear, concise, and graphical way which aids in decision making.
Online marketers heavily depend on analytics based observations while revising their existing marketing strategies or adopting new ones. For YouTube video marketing, this practice is of no difference. A video, whether an animated one, a short interview, cinematography, or a recorded demo through web conferencing session needs to be properly analyzed in terms of its usefulness and audience retention.
If you are new to YouTube analytics, or have not really used it to its potential so far, here are a few simple things you may try yourself to get a better yield for your next campaign. The objective is to guide you through the key performance areas of YouTube Analytics, and explain the significance of analyzed data in improving campaign performance.
Dashboard overview for consolidated reports
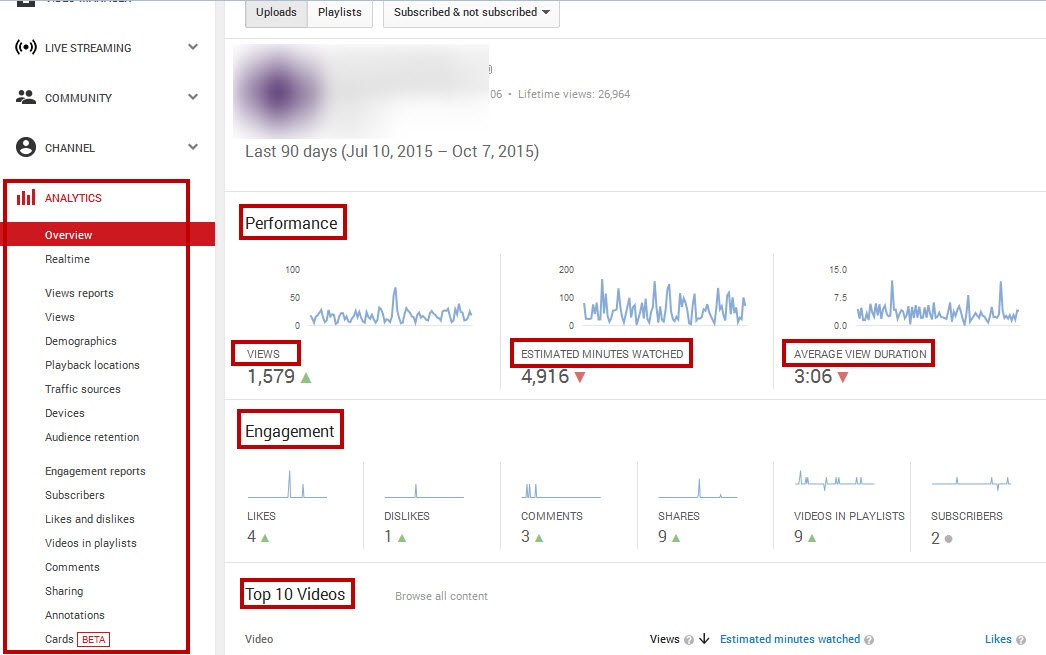
This is the first step towards creating a better video marketing plan. The major KPIs to monitor on a weekly, monthly, and quarterly basis are ‘Total Views’, ‘Estimated Minutes Watched’, ‘Average View Duration’, as well as ‘Engagement’ metrics such as Likes, Dislikes, Comments, Shares, Subscribers and the list of top 10 videos. The results will give you the following broad level insights:
• The overall quality of video contents produced by creative team
• Popularity, credibility and attractiveness of the videos
• The types of engagements and their growth trend
• Categories/types of videos that have higher appeal for longer period of time
The above metrics give marketers a bird’s eye view of key performance areas to be tracked and the broad level progress data for a certain period of time. Please refer to the figure below for better understanding.
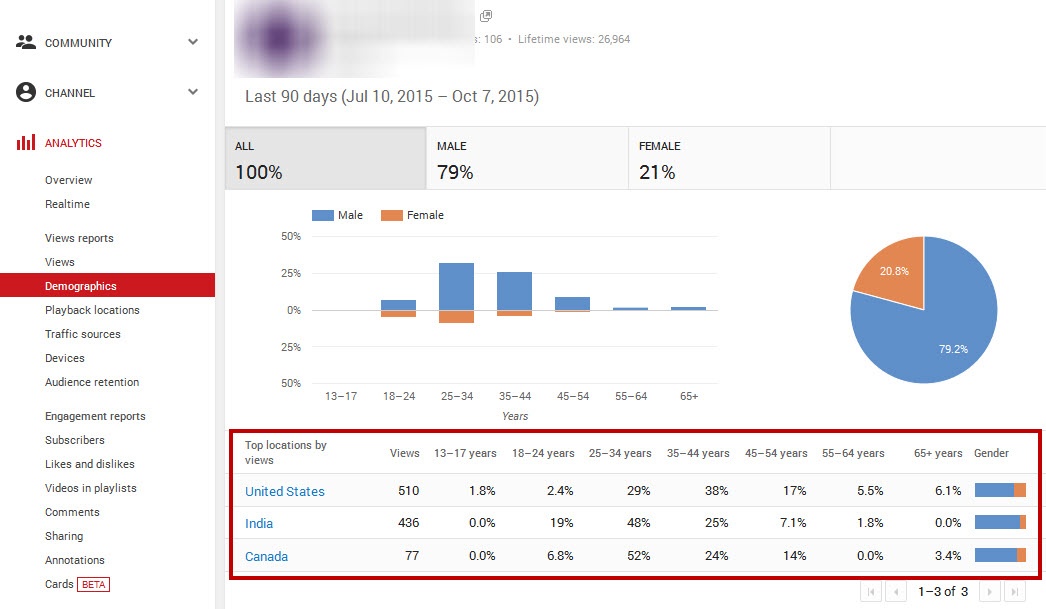
Demographics and Traffic sources for discoverability
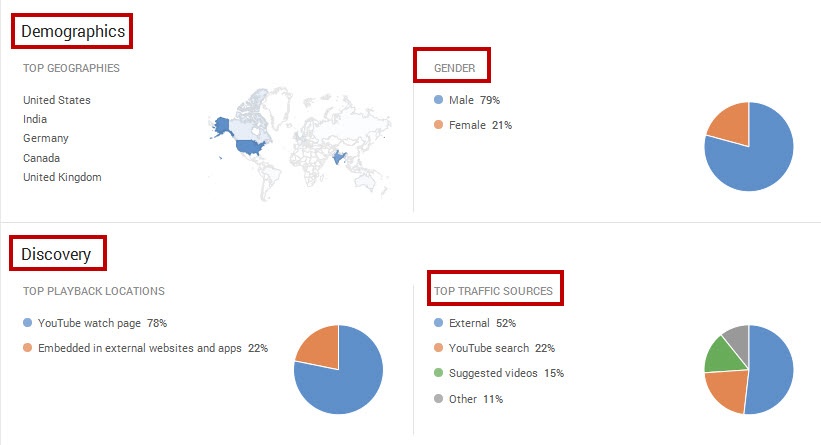
Knowing about the ‘Top Geographies’ helps you understand if your videos get any visibility in the targeted locations or not, and if you need to take external help to promote those videos on a regional basis, may be through Google Ads or paid video hosting.
Gender wise segmentation provides useful information to a marketer as the data gives additional attributes of influencers and key decision makers in a business.
The pie chart showing ‘Discovery Data’ tells a marketer if the videos need to be shared more through embedded code on external websites.
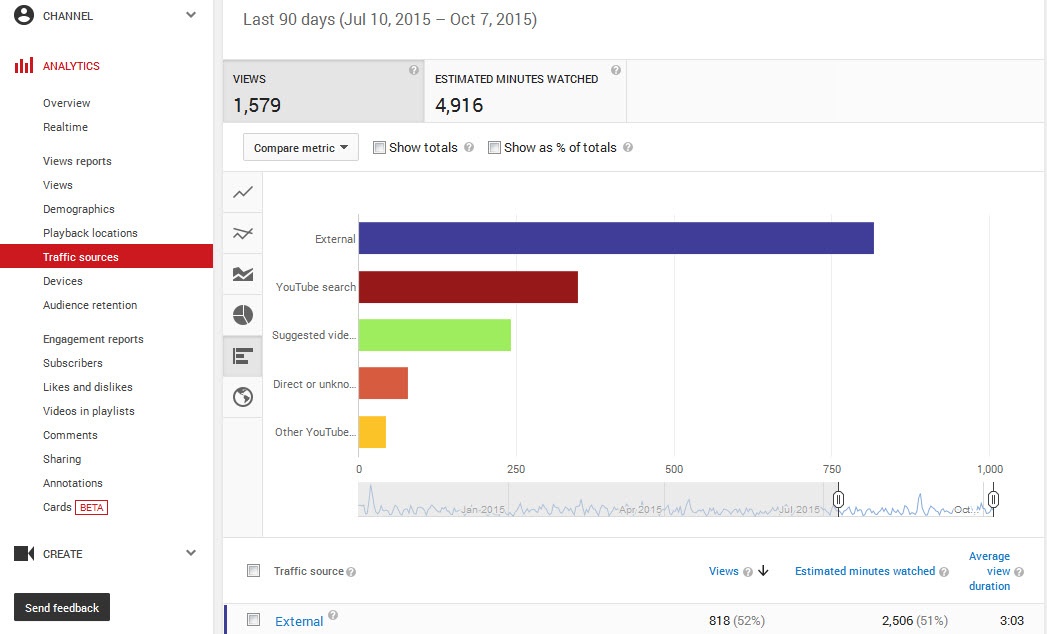
‘Top Traffic Sources’ lets you know if your videos are mostly watched from within YouTube through keyword searches, or are getting views from external sharing. Higher the percentage of ‘YouTube Search’ and ‘Suggested videos’, the better is for a video marketing campaign. Please refer to the figure below.
The drill-down data of ‘Traffic Sources’ gives a quick comparison of all the gateways that have contributed to a YouTube view. Higher the YouTube Search % for a particular video, higher the organic views it gains. The percentage of ‘Suggested Videos’ shows how relevant and contextual a video is to the larger audience of YouTube in terms of its similarity with other videos. Higher the percentage for ‘Suggested Videos’, higher the natural views a video campaign earns. Please refer to the figure below for explanation.
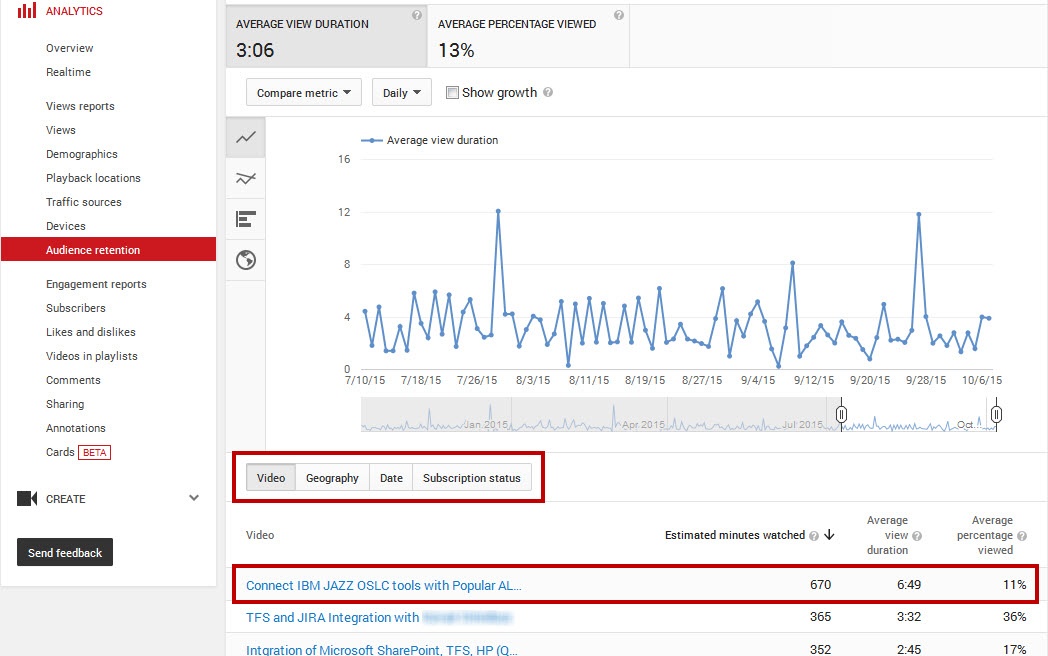
Audience retention analysis for individual videos
The ‘Average View Duration’ and the ‘Average Percentage Viewed’ data for individual videos provide performance related information on a granular level. The comparison metrics on a weekly or daily basis provide detailed insights of what made people watch a video for longer period of time on a particular date and what not. The information gathered can be used further by video marketing teams in order to follow the path of success. A video marketer can investigate further into each of the individual video statistics and see which video has contributed to the higher views in a particular week or month and why so. Please refer to the figure below for detailed view.
Views as per age group for deeper insights
The data as referred in the figure below tells what age group of people tends to visit your videos more often and if that age group pertains to your targeted audience, preferably the key business influencers and the top management people. The comparison data weighted against top locations helps analysts to do a better ideation and production of video content in terms of targeted age criteria and prime locations. Majority of the key influencers falls under the age group of 35-44 and senior management falls under the age group of 45-54 years and 55-64 years. So, if the majority of YouTube views do not come from your intended age group, it is time to rework on the video content and its specifications.
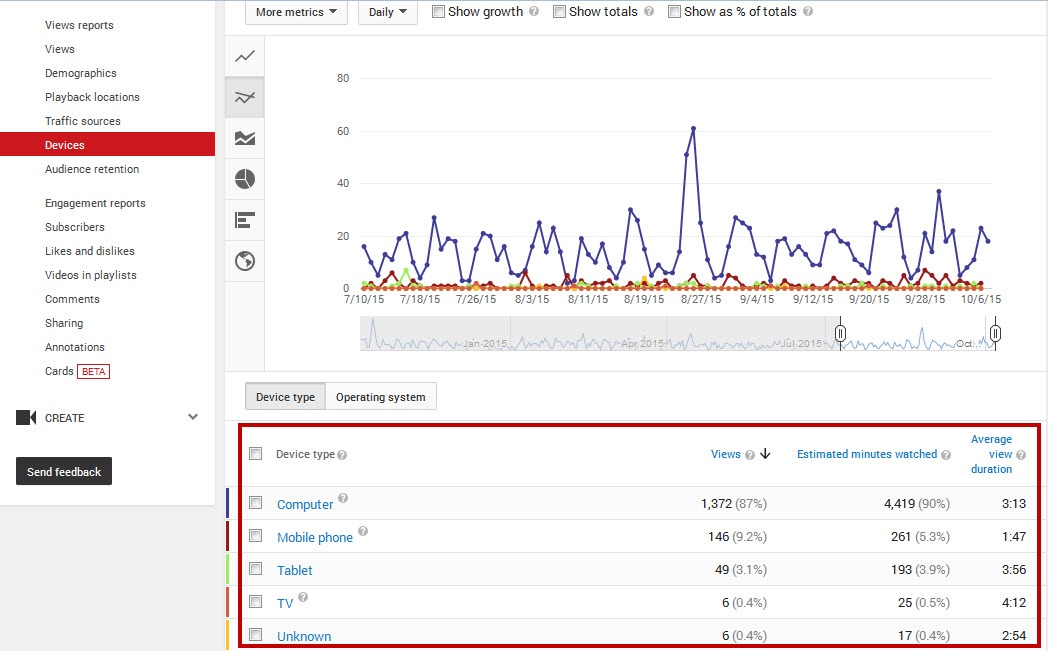
Device wise views statistics for customized production
A 15-20 minutes video watched in a computer may not have the same acceptability when viewed in a mobile having lower screen resolution. As a matter of fact, mobile viewers prefer shorter videos that last not more than 5 minutes. The statistics gives online marketers a fair idea of their videos getting watched in computer, mobile phone, tablet, TV and other devices.

The postmortem report tells if the video production team prepares the right kind of videos having shorter duration for mobile watchers. The comparative and granular level of data gives continuous feedback to the marketers and creative team so as to decide on what types of changes to make in which videos and what results the change should yield. Please refer to the figure below for comparative analysis.
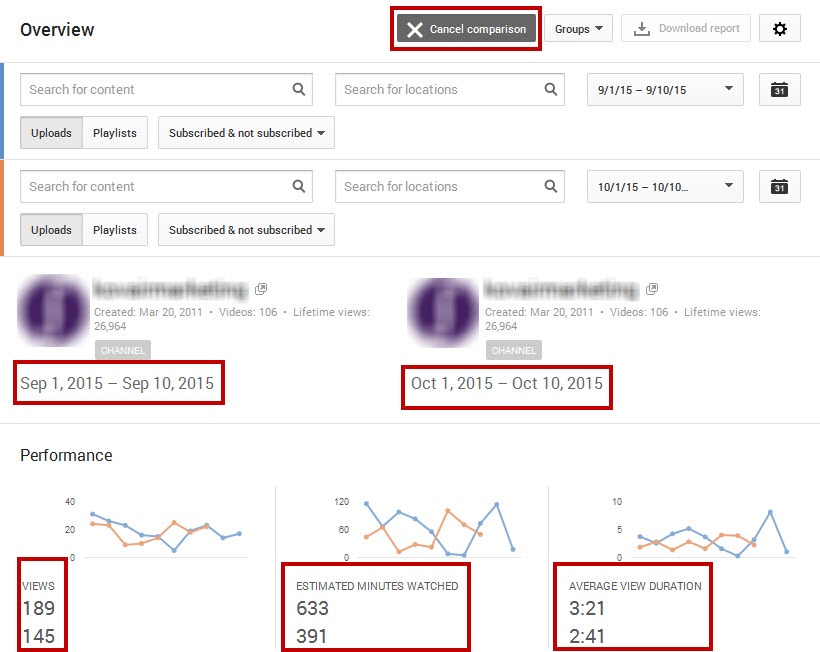
Comparative analysis of performance against time scale
Regular monitoring of results corresponding to the changes made in a video campaign helps marketers understand if the video production and marketing team are doing the right things at the right place and in the right time. The weekly, monthly or quarterly data showing deviation in performance not only guides you through the corrective actions but also tells you when to do it and to what extent. The figure below shows comparative view of video performance data for different time range.
How does quintly come into place?
quintly helps to combine all these stats, figures and numbers in one place. Thus you will get a holistic view about your own stats and activities of your competition. After understanding the basic metrics and defining KPIs for the own strategy it might be helpful to set up a dashboard to see dependencies between different numbers. Here are four metrics how that would look inside the tool.

Conclusion
The intuitive UI of YouTube dashboard and its graphical representation of detailed performance metrics cover all major aspects of video popularity which makes video marketing an organized and result-driven effort. However, marketers considering YouTube for their video hosting and promotion should also be active on the channel itself and understand the video searching pattern within the YouTube network. Uploading a video without keywords and tags insertion or using longer titles may affect discoverability of a video and in turn reduce its organic views.
If you stuck in understanding any terminology within YouTube Analytics section and its importance to your campaign, Google’s help is always there. So, log into your YouTube account today and start deriving key data from the analytics section.

Join the conversation. Leave us a comment below!