
The first indicator that probably every social media manager looks at is the follower count of a given profile. It is one of the most basic social media KPIs. Besides this metric, numbers like the amount of own posts are also very easy to understand. Yet in the end, they only identify how active the analyzed brand is on social media. If you want to refine your analysis though, there are plenty more indicators that are a bit more complex. One group of them revolves around social media interaction on your profile.
What does social media interaction mean?
With interactions we mean all ways that users can use to engage with a brand on any social network. There are different forms of interactions on each network. In the end, Facebook, Twitter, Instagram and Pinterest are rather similar in that regard. Basically, there are three kinds of interactions: likes, comments and shares. The difference is only that they have slightly different names and symbols. So while you comment on something on Facebook, the equivalent on Twitter would be a reply. A share on Twitter would be a retweet, while on Instagram there is no default option to share at all. But each of these networks uses the word “like” to signal that you favor a certain post.
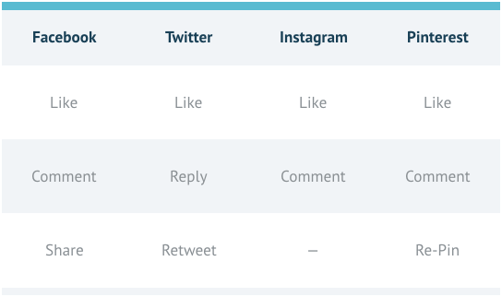
As you can see, these four platforms offer rather similar means of engagement, however, Instagram sticks out with not offering a share feature and Pinterest has a different system built around its pins. Now that we know what interactions can be and how they vary among Facebook, Twitter, Instagram and Pinterest, let’s look at ways to measure the interaction in social media. However, as the latter is in some parts quite different from the other three, we will leave Pinterest out in this article.
Measuring your performance with interaction metrics
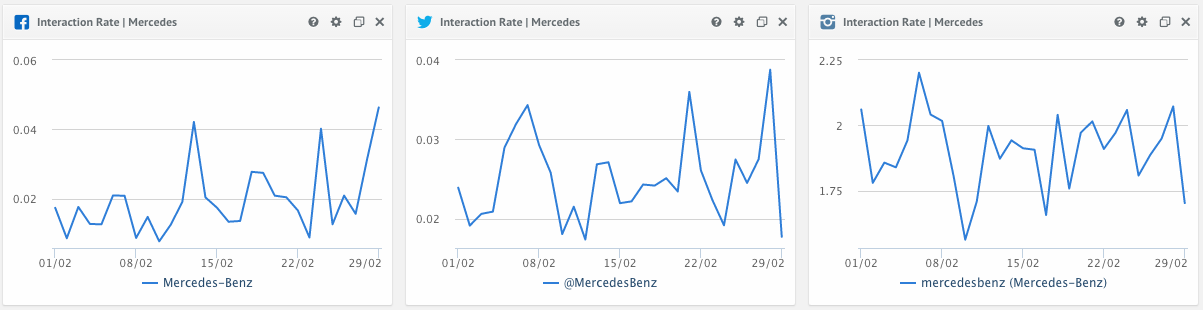
So let’s pick a real life example of a big brand that is operating on all major social networks. Therefore we have chosen Mercedes Benz, a global brand that is very active on social media. All data in this article has been collected in February 2016. In the following, we will generally describe the function of the presented interaction metrics and what information you can get out of them in this specific example. The first interactions related metric we will be looking at is the interaction rate.
Step 1: Look at your and your competitors Interaction Rate
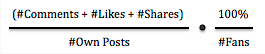
The Interaction Rate, which is also sometimes being referred to as Engagement Rate, is an indicator that compares the interactions of a given social media profile irrespective of the amount of the followers. The result is a combined index of the sum of likes, shares and comments per own post, standardized by the total amount of own posts and followers. This metric, however, has to be used with some caution. As the sum of interactions divided by the number of own posts is again multiplied with the ratio of followers, a rising number of people following your profile can drag the rate down. This happens when the absolute number of interactions does not rise accordingly to the follower count. So always keep that in mind while interpreting this rate.
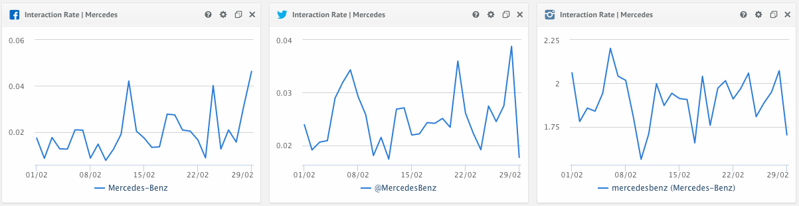
As you can see, the interaction rates for Facebook and Twitter are not too different, while the former is overall slightly leading regarding its peaks. However, if you consider Instagram, this metric shows that there are much more interactions on the photo network than on the other two. So if you especially want to achieve many likes you should clearly choose Instagram for increased spending.
Step 2: Anlyze the Interaction Distribution of your posts
The Interactions Distribution metric describes the percentage of likes, comments and shares your profile got. In this way you can easily see what interactions appear most often or the least. Based on these charts, you will see that the networks attract different behavior by their users.
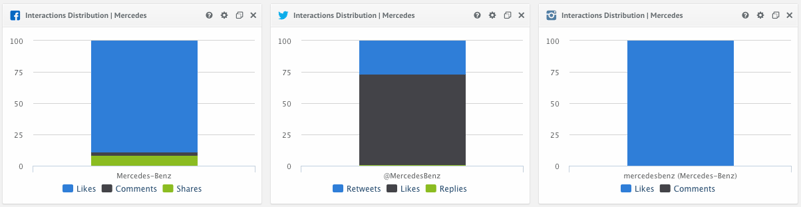
In our example you can see that on Facebook there is a vast majority of likes (88.8%), shares come second (8.3%) and there is just a small amount of comments (2.9%). The situation in Twitter is not much different with the most used interaction type being likes (72%) with retweets on second place (26.8%). On Instagram, there are almost no comments, with the likes accounting to 99.5% of all interactions. So obviously the “easiest” form of interaction, a simple click for a like, is the most common type. Based on these findings, you can draw relevant conclusions for optimizing your social media campaign. For example, as people don’t seem to be willing to engage in big discussions on the image heavy Instagram, you won’t need to invest a lot in encouraging comments.
Step 3: Determine Your Interaction Rate by Post Type
With this metric you can analyze the interactions for specific post types of a profile irrespective of the amount of their followers. The result is a combined index of likes, shares and comments per own post, standardized by the total amount of own posts of that type and followers.
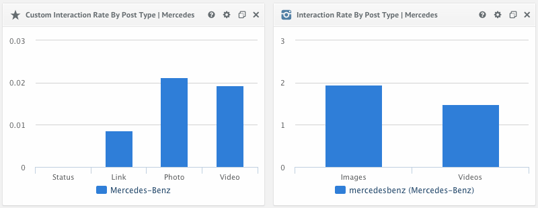
In these charts you can see the visualized data for Facebook and Instagram. Unfortunately, it is not possible to track different post types on Twitter as the network does not provide any information about them. It is clearly visible that visual posts receive the highest interaction rates on Facebook. Accordingly, the biggest part of all brands on the network refrain from posting plain status updates anymore. On Instagram, which is a visual network by definition, is still encouraging the most interactions for images. Overall, photos are the most successful post type regarding interactions on both networks. The conclusion that can be drawn from this metric is that it makes most sense to invest into picture posts.
Optimize your strategy with social media interaction metrics
In this article we looked at three different interaction metrics. First, we talked about the interaction rate that makes the total amount of interactions comparable also between profiles of different sizes if you want to benchmark your profiles against other brands. Secondly, the interaction distribution tell what kind of interaction you receive the most. So you can see if your followers rather just click the like button instead of commenting. The amount of shares can let you know if your content is perceived as worthwhile and thus gets shared. At the end we explored the interaction rate by post type. With this metric you can see what kind of content receives the most interactions and is thus more successful.
Have you used interaction metrics so far? If not, start optimizing your social media analytics process now!


Join the conversation. Leave us a comment below!