.svg "quintly-logo (1)")
During 2015 we published our Instagram study of Q1 and Q2. To keep marketers up to date, we have now analyzed the whole year of 2015. By looking at the numbers we were able to identify interesting developments during the year. Instagram has often been reported as the “place to be” for brands and their storytelling. To get your campaign right, it is highly essential to understand the network-related data that backs up your decision-making process. Accordingly, goals have to be set on how the network is developing, therefore our Instagram Study 2015 help marketers to identify everything important during the year.
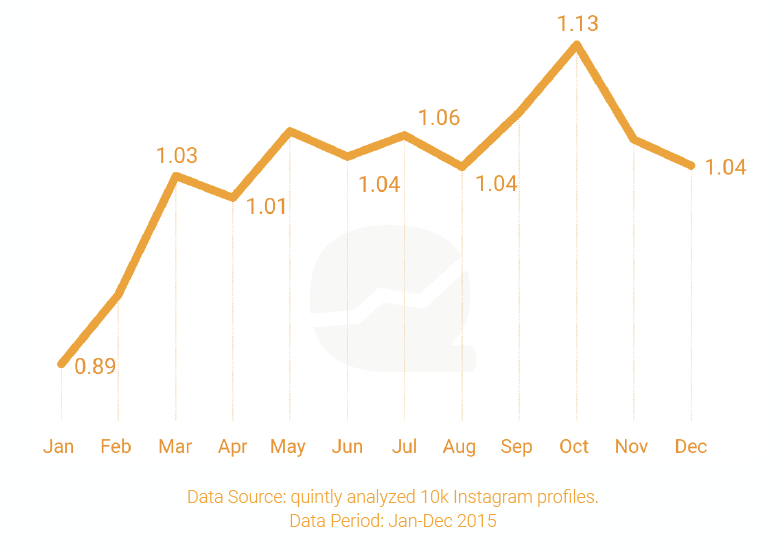
Instagram posts per day
Instagram, as a place to tell your brand’s story, is not considered “nice to have” anymore but it has taken its place directly beside the big social media dinosaurs Facebook and Twitter. Thus, brands want to get more active in the network. Accordingly, the frequency of own posts increased from 0.89 to 1.04 posts on average per day.
Image and Video Posts per day
Going one step deeper into the analysis we took a closer look at the post types. First, image posts slightly increased in 2015. As video content is on the rise on every network and businesses ramping up on video content, video posts almost doubled in the analyzed period. In numbers that means video posts increased from 1.78 posts per day to 2.77. With a little drop at the end of the year, it will be interesting to see how the development continues in 2016. Just subscribe to our blog to stay in the loop on these Instagram stats.
Instagram Growth Rate
As well as the “King of Engagement”, Instagram was reported as the fastest growing network in the last two years. Now that early adopters are already a few years on Instagram, we wanted to take a closer look at the growth rate of the average profiles. Starting 2015 the average profile grew pretty fast with an average growth rate of 21%. Until the end of the year, this growth slowed down to 16%, which shows that Instagram becomes increasingly grown-up, as the networks reaches higher “saturation”. An assumption for next year could be that the growth for businesses active on Instagram slows down further. This is essential to know while communicating on the network as goals have to be set differently than in the previous year, to be still achievable. So, quickly over to you! Check your individual goals on Instagram. Are they achievable in 2016, or harder to reach than last year? Take the decreasing follower growth into account when talking to clients, or when you report your goals to your upper management. The more grown-up Instagram becomes, the more detailed your Instagram Analytics has to get.
Distinct Drop of Interaction Rate on Instagram
Probably the most interesting finding in our Instagram study 2015 is the significant drop in interactions. As seen in the chart below, the interaction rate dropped from 4.96 to 3.10 during the year.
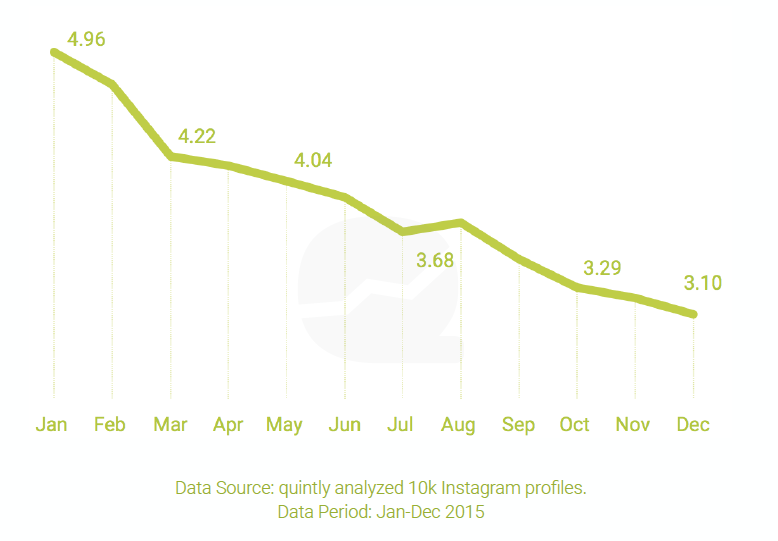
First, due to higher post frequency of the average profile (as reported earlier) timelines get increasingly crowded. If you followed the same profiles in January and December 2015 it is most likely that you see more posts now as you did 12 months ago. But as you see in this study, more posts does not always mean more interactions. The second factor here is caused by the formula that calculates the interaction rate, which is all interactions divided by posts and followers. That means, the more followers each profile gets, the smaller the interaction rate will get.
As seen in the slides from eleven onwards, the absolute numbers reflect the drop simultaneously. In these slides you will be able to identify the drop specifically for your profile size as we clustered the profile sizes in six different sized groups. Especially in the cluster of 10k-100k followers interactions experienced a distinct drop. In January 2015 the average profile in this sized group received 1,000 likes on each image post, 12 months later just 598.
When we looked at specific quarters this trend was noticeable but not as significant as analyzing the whole year.
In a nutshell it can be said, that Instagram seems to get a grown-up. This can be seen for example in the drop of growth and interaction rates. Additionally, we were able to reveal that many businesses seem to ramp up their marketing efforts on Instagram as the post frequency constantly rose in 2015.
Have a look at the study, find numbers for your business and compare with your past performance. Based on that you will be able to set the right goals for the future.


Join the conversation. Leave us a comment below!