
Content Marketing developed as a crucial part of a company's communication strategy to reach their target group in a less advertising manner as conventional methods. In the end this strategy should provide content that informs and helps your visitors. Social media channels are used to push content marketing efforts out to fans, followers and thus (potential) clients. Without a doubt, content marketing can be a highly effective strategy in reaching an appropriate audience – but as every other strategy – it has to be measured. Therefore, it is essential to pick the correct Content Marketing KPIs in your social media strategy.
Having said that, Content Marketing is a controversial technique to approach your audience since a while, and the probability is quite high that your competition invests in their storytelling approach as well. Therefore, you need to measure not only your own performance in detail but also how your competitor's content performs. For a broad understanding on how you and your competitors are being perceived among your target groups, we will explain three metrics that enable detailed views into your and your competitors posting patterns.
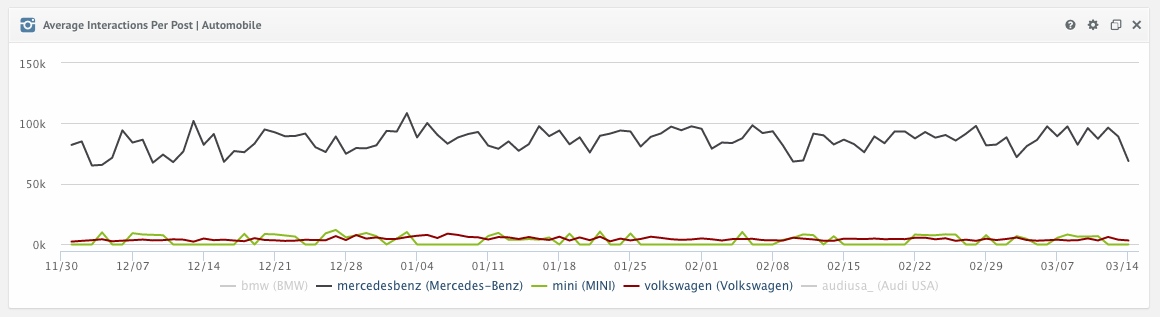
Content Marketing KPI #1: Average Interaction per Post
The first two content marketing KPIs we want to present, help you to measure not only yourself but also your competition. Benchmarking your performance against your competitors is a great way to stay ahead of other players in the market.
While finding your right social media KPIs the average interactions received are most certainly interesting for you. This metric shows on the one hand how many people have been engaged per post and on top of that our line chart visualizes developments over time.
Content Marketing KPI #2: Follower Growth / Follower Change
Every strategy aims towards reaching more people to share your stories. To analyze how that worked out in the past Follower / Fan Change is a great content marketing KPI.

After a first understanding of your and your competitors’ strategy you should dig deeper into the analysis of your own performance. In the following we describe three metrics for Facebook Insights.
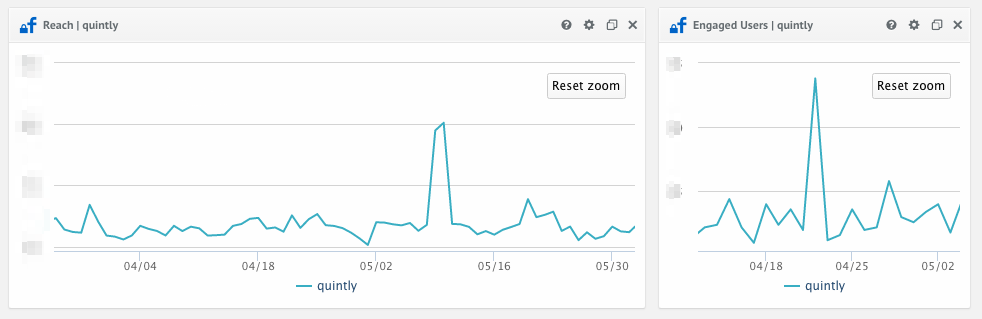
Facebook Insights Metrics - Reach and Engaged Users
Our Facebook Insights metric helps you to understand the “reach” your posts had. The line
chart helps to understand the development in the analyzed period of time.
With this chart you are able to identify peaks and thus posts that performed the best. This is especially important to analyze for social media marketers while a new social media strategy is tested. Through the approach of measuring reach, you are able to detect the development of people you reach organically over time. The metric shown on the right hand side shows engaged users which is one step deeper into the funnel. Engaged users are the ones that engaged with the content posted. This includes all reactions such as likes, love, haha, etc., comments and shares. With this metric you can identify posts that not only reach people but also that is “reactionable”.
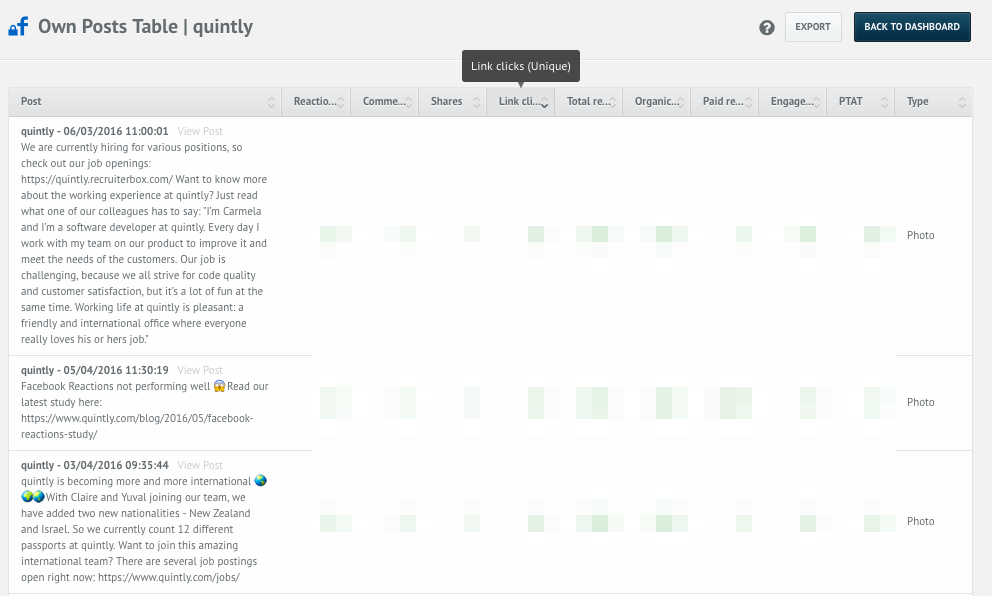
Facebook Insights Metric - Link Clicks
The goal of many social media campaigns is to bring people to your website. To measure that goal effectively, not only reach or engaged users are the social media KPI to choose. Therefore the Facebook Insights metric Link Clicks shows you the exact numbers on which posts were able to achieve the highest number of link clicks.

Join the conversation. Leave us a comment below!