
Facebook is still standing tall as the most popular social media network for users and brands are investing heavily into their social media marketing. It offers interaction with users that show admiration for the brand and can be valuable as a more personal approach to new customers. But how well are the top brands on Facebook really performing? It’s one thing to see if they are still showing up in your timeline, but are they still posting as much as before? Is high activity on the network still being rewarded? What can you learn from their performance? Let's analyze their Facebook performance!
Critical voices claim that the golden era of Facebook is over. To find out how much truth there is to this evaluation, we started out on the quest of analyzing thirty Facebook profiles of brands with some of the highest amount of likes. Among these were brands like BMW and Mercedes-Benz, Adidas Originals, Nike and also food brands like Oreo, Skittles and Coca-Cola.
For full disclosure of the specific profiles we analyzed, access our study below.
We took a look at their performance during the first half of 2016 to find out more about development in likes, posts, user interaction and other key performance indicators (KPIs - to learn more about these, check out our blog post on social media KPIs). Our analysis shows that Facebook critics claiming that the network is dead couldn’t be more wrong!
Big brands still attract new followers
Looking at the overall development of the average amount of fans, there was a nearly linear growth from 38,160,209 to 38,504,247 - roughly speaking, the average brand profile acquired around 344,000 new fans in the first half of 2016.
This is a very positive sign for all big brands on Facebook, since it means that the platform is still offering a growing base of fans. This also tallies with findings from an earlier study which showed that Facebook is still going strong as a platform.
The monthly fan growth, which was positive over the whole period, fluctuated slightly throughout H1 2016 but showed a rising tendency. On average, the 30 brands were able to acquire around 66,500 new followers per month. There was little growth in January and a notable peak in new fans in March and June.
Steady decrease in total amount of posts
The average number of own posts by the brands showed a significant and steady decrease, dropping from an average of around 150 posts per month in January to an average of a little less than 100 posts per month in June. The strong decrease in posts is an intriguing finding that could be interpreted in many ways. This makes it hard to determine a definite cause for this development.
Own Posts dropped by more than 30%
When looking at the number of own posts, it is important to note that the amount of posts varies greatly among the thirty brands. For example, the Starbucks page only published a post about once a month (8 posts in the first 6 months of 2016). In the same time, MTV posted a stunning 12,134 times. With such a small data set, one page like this already changes the average quite a lot. What’s also interesting is that even though the Starbucks page is not very active, it still acquired much more likes than the smaller pages. This might be a sign that users don’t value frequent content as much as one could imagine.

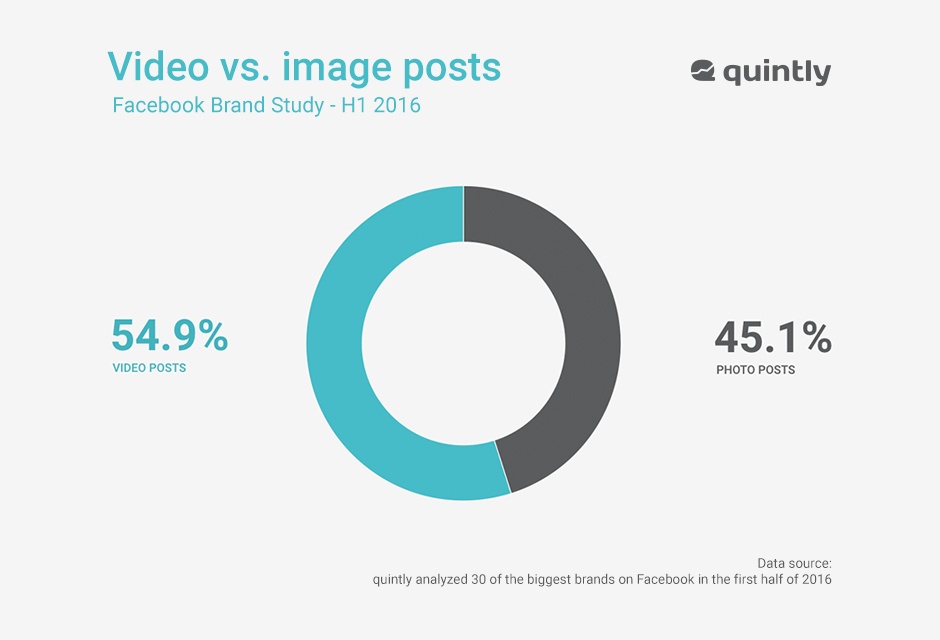
Photos vs. videos: Which content works best?
In total, there were more video posts than photo posts published by the thirty top brands on Facebook in the first half of 2016 as you can see in the pie chart below. This is also true when looking at each month of the first half of 2016 separately. The fact of there being more video posts relates to a general trend of brands having incorporated videos into their marketing strategy as one of the most engaging forms of content, thus benefitting from users experiencing the brand in a more exciting way than via a picture or simple text. Another major advantage is that brands can transmit so much more content with a video, and if this content is shared, the outgoing information is much more extensive.
Fans engage with top brands on Facebook
The overall interactions (including likes, shares, comments) remained stable at around 4,900 interactions per month per post, with a slight drop in March. A little side note: Interactions do not include Facebook Reactions (Like, Love, Haha, Wow, Sad and Angry). When looking at this interaction count, keep in mind that it is the average over all the profiles. So when MTV posts an average of 67 times a day, of course the amount of likes is much less than that on a Starbucks post that is one of 8 in 6 months. Still, in average, this is a pretty impressive number - imagine 5,000 people in one place!
There was a slight upturn in shares of posts and comments. However, if you look at this graph, it shows that in relation to a total of around 5,000 interactions, a change of 100 is not that significant. On the other hand, shares and comments are somewhat more valuable interactions, since they require a higher status of activity than just pressing a like-button. Keeping this in mind, an average growth of around 100 in shares and comments is a steady development.
To see our analysis of user posts and responses and our findings on how Facebook is being used as a customer support medium, access the study below!
Brands on Facebook - Takeaways!
To sum things up, Facebook is a great platform for brands to be active on - with the highest amount of members (1.7 billion monthly active users in the second quarter of 2016) there is a giant audience, and the fan counts of the brand profiles show they also actively express their sympathy and interest in a brand. The interaction shows how much the everyday user likes to be in direct contact with a brand’s representatives. The high amount of user posts is an indicator for how much fans like to be involved. This also makes communication on Facebook a state-of-the-art form of customer support, with many comments and user posts including requests for assistance.
Being active on the social network is still very much worth the effort, with the rising numbers in fans showing that Facebook is continuing its growth. To see our analysis of user posts and responses and our findings on how Facebook is being used as a customer support medium, access the study below!
Should you have any further questions on this study or quintly in general, don’t hesitate to reach out to us. We are just one tweet away!
❗️ What you need to know when looking at this data is that we analyzed the default pages of some brands that split their Facebook presence into regional Facebook pages. When brands switch to this global page structure, the fans are initially assigned to the according country page based on their user location. You can also choose manually which page you want to be directed and assigned to. The default page is the one you are directed to when there is no regional page assigned to your location. For this reason, brands like Facebook itself are represented by their default page in our study, which does not include the full fan count but only a portion. In most cases, the default page was the brand’s page with the most fans - with the only exception being CocaCola, whose Brazilian regional page had the most fans, so we analyzed this regional page. When looking at the list of profiles, please note that some, like Starbucks, have several different Facebook pages for different countries, too. However, it’s not the same structure as with the default and country pages, but Starbucks simply set up a @Starbucks account (which we analyzed), and next to this @Starbucksperu, @StarbucksFrance, @StarbucksDeutschland and so on… Here, the fan count we analyzed is the fan count that’s also displayed on the Facebook website. For more information on this, please refer to the Facebook Help Page.

Join the conversation. Leave us a comment below!