

When we’re working we often try to make processes faster and more efficient so we can focus on more important tasks. When I started in early 2015, web analytics was mainly done manually. Now most of it can be automated.
The tool quintly does exactly that for our clients. At quintly, we help to automate and set up more streamlined processes in the field of social media. This article will cover the most important aspects how this can be achieved.
We Aggregate Data and Visualize It
quintly uses the networks’ APIs to gather data. I always picture an API as a big hose that plugs into Facebook’s data sources e.g. and pulls all data to quintly. As this process is standardized by our workers, our users receive the same data in the same quality.
-3.jpg?width=940&height=529&name=quintly-Data-Collection%20(3)-3.jpg)
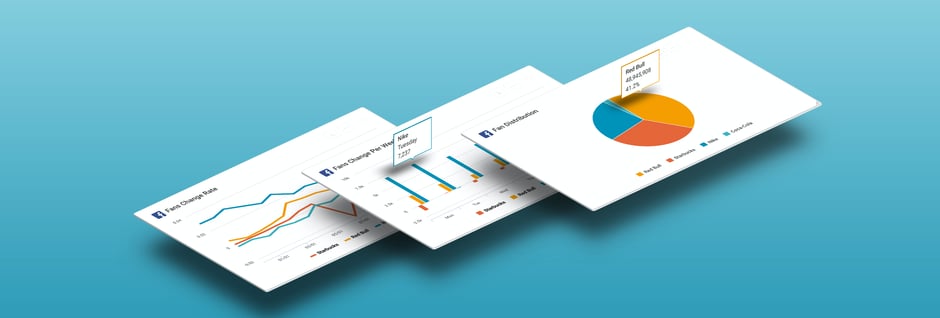
As the APIs are the official data end points, the data cannot be better in terms quality and accuracy. The tool quintly, as well as any other social media analytics tool, visualizes this data in graphs. This is a handy way for clients to see what worked, what didn’t, compare performances, and benchmark themselves.
Some clients do not want to use the quintly interface but just the data we gather and plug this into an own interface. This is also no problem, as we offer an API.
You may ask yourself why not use Facebook’s API directly. The big disadvantage here would be that you need to do the maintenance yourself. And you can ask our team—it comes with a lot of work!
Facebook often implements changes with data endpoints, and updates to their API affect the data we see. Our team identifies that, immediately jumps on the issue and adjusts them. The good thing: This happens just behind the scenes at quintly! You as a user can lean back and let us do the work, so you won’t be affected.
In short, our team automates the process of gathering and displaying data with the highest possible data standard.
Hundreds of Metrics and Endless Possibilities
Metrics are the fuel for today’s marketing. A standard set is crucial to make activities comparable. This is the only approach how you as a marketer can decide which actions paid off at the end, what are worth continuing, or which didn’t meet your expectations.
Here, quintly can do something great. Something unique in the whole social media analytics market. With quintly you can not only choose pre-made metrics, but also adjust metrics to your needs or even create your own.
That means, you can either:
- Use a default metric such as “Engagement per Post” and leave it as we defined it. This makes sense in many cases where no customization is necessary
- Weight factors / components of a metric like Interaction Rate differently. That means to give comments twice as much weight as likes. This depends on how your company defines interactions and what’s the exact goal.
- Taking customization to the next level, with quintly companies can also create own metrics. Through this you can create one number across the company to measure success correctly at a glance
Find an example on how you can build your own success formula within quintly here.
Hint: Once set up your have one number with that you can measure the success across teams, branches and departments, which is especially interesting for larger organizations. Worth looking into this.
Dashboards: The Foundation for Great Reports
After having covered metrics, I now want to dive deeper into dashboards, the place where metrics get bundled.
The first important note always is that dashboard should be topic-oriented. To be precise, this is the place where you bundle metrics that all approach the same question.
Examples can be: Competitive Content Analysis, Deep Facebook Insights (analyzing your own profiles on a deep private data level) or Customer Relations (analyzing your vs. your competitors response rates / times).
So, let’s picture the following. You lead a team of 6 people in an agency working on a client project. You defined the metrics with your client and set up an own success formula together with our support team (Kudos to them, they do a great job!). Now it’s time to create a new dashboard in quintly and add all metrics you need to it.
Done? Great! Now you can set up a report with a couple of clicks and you and your team receive a report every Monday morning at 9am before coming together for your weekly meeting. Handy, right?
The great thing is that this dashboard can be used with different profiles applied. Meaning to say a different team, working on a different client, uses the same KPIs for a similar use case. This makes everything comparable and transparent and on top of all that saves a ton of time, once set up.
Automate Processes, Save Time
A tool like quintly can help you save time by maintaining data access via network APIs for you. We’ll also let you know soon enough when there are changes coming. With customizable metrics you can automate exactly how you want to measure the success of your or your clients’ social media communication. Use flexible dashboards to create worthwhile reports that show the real impact of what you have done. If you want to try it out now and see by yourself how you can automate your analytics process, just sign up to a 14 day free trial.

Join the conversation. Leave us a comment below!