
Digital marketing is becoming even more important in 2018 – that’s no big surprise, and Facebook marketing is one part of it. Compared to classic marketing channels, social media is still a rather uncomplicated means to convey your marketing message. However, the early euphoria of quick success is a thing of the past. Facebook pages must now be closely monitored to know exactly what your impact is and to keep your social media strategy state of the art. This is why this blog post gives an overview of how to analyze Facebook data.
First, I will talk a bit about how to approach your analytics process in general with our Social Media Analytics Cycle. Then we’ll have a look at several important Facebook metrics and KPIs, both on a public and private level for Insights. I will then give a little introduction on how to create an effective Facebook report.
How to Use Facebook Analytics
1. Assess data on your current Facebook performance
2. Set goals based on your previous performance and benchmarks
3. Create reports that are tailored specifically to their goals and recipients
At quintly, we firmly believe that each marketing strategy needs to be assessed according to your individual goals. This can be achieved by setting the right metrics and KPIs that really measure what you aim for. Nevertheless, there needs to be a clear approach on how to conduct your analytics process. To give an example, we created the Social Media Analytics Cycle based on our expertise in social media analytics. It serves as a model/guideline for any social media marketer in order to conduct an assessment of your company's performance that is spot-on and effective.
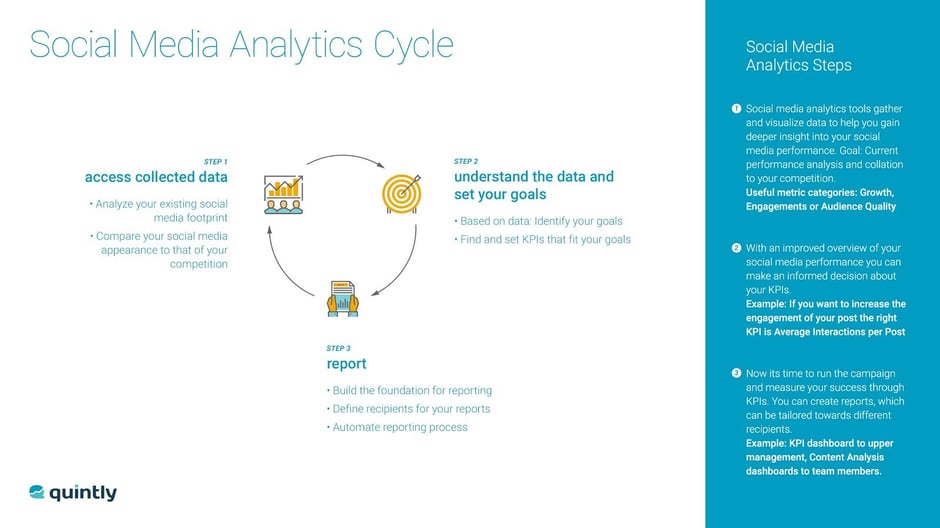
Step 1 is about getting to know your current status, answering questions like “When does my page get new fans?” or “How many interactions does my content receive?” To broaden the perspective and get a bigger scope of things, it is wise to benchmark your own performance against your competitors.
Step 2 is about thinking more deeply about the collected data in order to set the right goals for achieving great results with your social media marketing strategy. Subsequently, this step is about choosing the right metrics and KPIs to effectively measure your goals.
Step 3 is about creating reports that keep you up-to-date about your social media performance for your set goals. Automate these reports to save time and keep yourself, your colleagues and your management on the same page.
Choose the Right KPIs to Reach Your Goals
To create an analysis that supports a successful Facebook strategy, it’s vital to choose the right metrics and KPIs for a powerful dashboard. A good starting point for me is to get an overview of the own performance by looking at some more general metrics. For reporting, this will also make sense if you want to give a good insight to someone who doesn’t know about your performance well, like an outside party.
For an example in this blog post, I have chosen to look at the three major mobile carriers in the US: AT&T, Verizon and T-Mobile, for the month of November 2017.
Facebook Fans Increase: Total Fans and Fans Change
First, let’s look at two rather basic metrics – the total development of the fans and also when you gain new or maybe even lose some fans. You might now think that this old news. And of course, you are right: It’s no secret to look at these numbers. Nonetheless, it makes sense to include them in your Facebook analysis as fans can still build the ground of your social media marketing success.
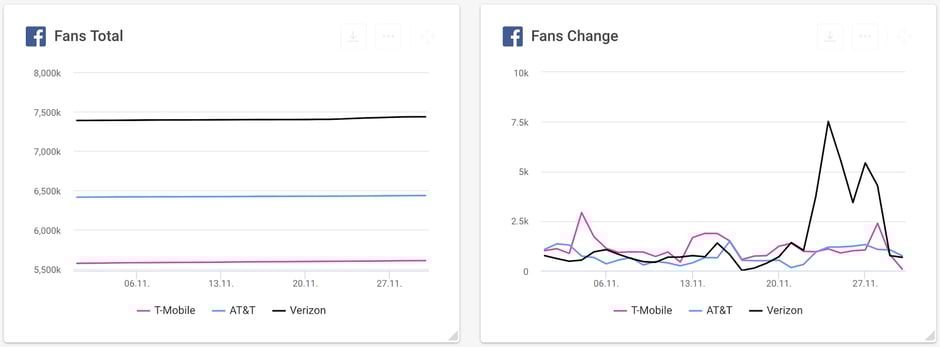
For our example, we can see in the Fans Total metric that Verizon is leading the pack by roughly one million fans, with AT&T coming in second and T-Mobile coming in third. It’s already interesting for Verizon to see that they come in first – clearly. But much more interesting is the answer to the question: “How do I get new fans?”.
You can easily spot the answer to this question by looking at the Fans Change metric above, finding two major peaks for Verizon. With an analytics tool like quintly, you can use this data to identify if there was certain content that went viral and then caused a jump in fans.
Often, it’s also worthwhile to include data from outside of social networks to find out what caused certain outside effects. Our analyses of the US presidential elections showed that fan increases often occur at the same time as politically relevant events. The same can hold true for legacy media campaigns that influence your social media channels or also negative news that can cause fan losses.
Tip: Benchmark your fan numbers against competitors to find out how they gain more fans by events that cause peaks in the data.
More Engagement: Total Interactions and Interactions Distribution
Engaging the customers to bring them closer to the product, that’s one of the primary goals social media marketers aim for. To engage fans more, well made and exciting content is needed - content that fits Facebook’s platform and is attractive for consumption in the users’ free time.
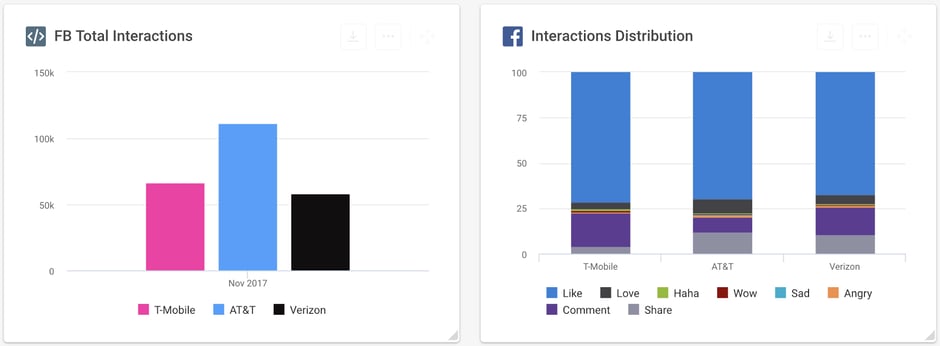
Looking at the total interactions for a page is a good starting point to gain some intel on how engaging your overall content is. This number summarizes all reactions (including likes), comments and shares.
In our example, we can easily spot that AT&T is taking the lead over T-Mobile and Verizon. Remembering the fact that Verizon has more fans being users potentially interacting with their content, AT&Ts content seems to engage their fans much more than Verizon’s. At the same time, this could also mean that AT&T spends much more ad budget on Facebook to increase interactions than Verizon.
Treating all interactions similarly is a nice start to get an overview, however, all of them mean something quite different. A like has a different quality than a comment which has a different quality than a share. (This is by the way one of the points from our latest paper containing 5 ideas to optimize your social media strategy) This is why it’s worthwhile to look at the distribution of these different interaction types.
Let’s assume that the goal is to spread content out to more users. Then a share would be more valuable than a comment, considering this is a way to get your content out to more people.
Tip: Think about what your primary goals are in terms of interactions and consider the different types.
Better Customer Service: Analyzing User Questions
Chances are high that you have at least once asked a question to a company on social media. While some businesses have dedicated customer care channels on Facebook and other platforms today, others answer questions on the side and some even still have user questions deactivated.
In case you use Facebook for customer service, it makes sense to monitor the questions that you get and how you answer them. A social media analytics tool like quintly can help you do that and achieve maximum satisfaction with you fans.
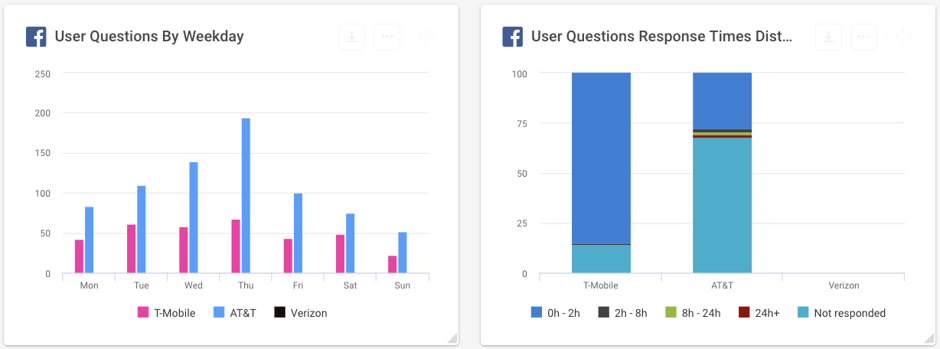
Two helpful metrics for this are the User Questions by Weekday and the User Questions Response Times Distribution. The former lets you analyze which weekdays are the busiest, helping you to find out the biggest demand. This enables you to allocate your resources right to answer the users’ questions appropriately.
In our example, the first thing that stands out is that Verizon has seemingly deactivated the option to receive question as there is no data for them. For the other two, we can observe that AT&T gets many more questions, showing the highest average volume on Thursdays for the analyzed ?. The same holds true for T-Mobile, while it also gets the lowest average volume on Sundays. Interestingly, this shows that people tend to ask questions mainly during business days, even on social media.
The User Questions Response Time Distribution metric shows us how quickly businesses respond to requests. While AT&T receives more questions, they tend not to respond to all almost 70% of these. In the case of T-Mobile, this only 15%, while they answer to around 85% in under 2 hours.
Tip: Closely monitor when questions come in and how fast you answer them to achieve higher customer satisfaction.
Getting More Attention: Facebook Reach
Is it the holy grail of social media marketing? As often as reach is discussed in blog articles, one could certainly think so. At the same time, the decline of overall reach has also been discussed vividly. Nonetheless, one of the main goals besides engaging people is actually reaching them first. So no matter of you bet on organic or paid reach, it remains an important metric to monitor.
Reach is a so called Insights metric, meaning the number is private and cannot be benchmarked against pages to which you don’t have access rights. This is also why we have used another page for our example.
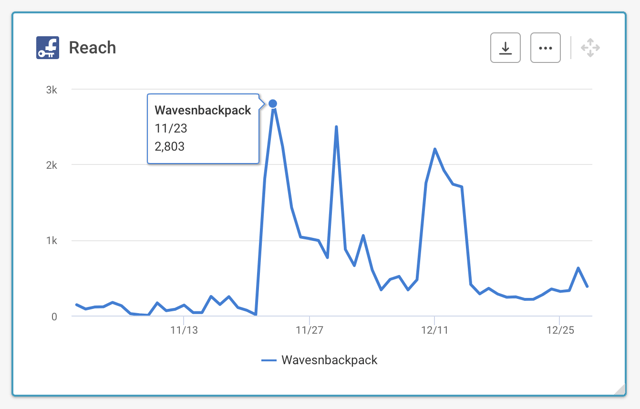
You can see various distinct spikes above. The metric gives you the option to identify content that gained high reach by looking at this in retrospect. While doing so, it’s recommended to also distinguish between organic and paid reach by using additional metrics that show this split.
Tip: Also look at the reach metric for a longer period to see if you have gains or losses over the long run.
Tip 2: Have a look on your watch, when you post on social! The timing of a post can massively influence reach.
Spending Your Money Right: Ads Objective Distribution
One way to reach more people or to create more buzz is running ads. Sometimes, however, it’s not so easy to keep track of all the campaigns within Facebook. For example, it’s important to have a good overview on what goals you actually cover with your ads in order to see if you really work towards the goals that you have set.
Ads data, just like data for reach, is also private, so you can only see it if you have advertisement rights for the specific profile. Accordingly, you cannot see this information for your competitors.
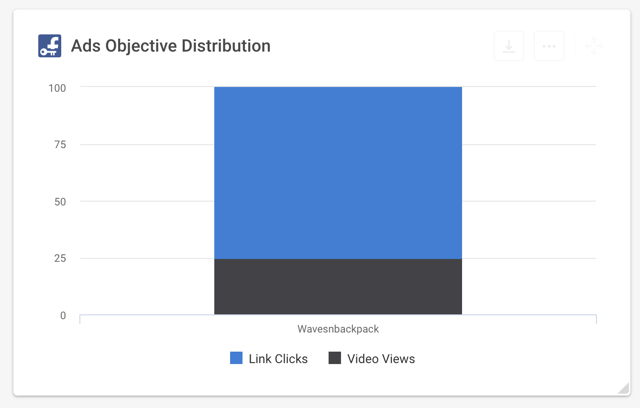
In the example above you can observe that around one quarter of all ads for the analyzed period belonged to campaigns that aimed for generating video views. The goal of the rest was to achieve more link clicks.
Tipp: Try to combine ads metrics with Facebook performance data in your dashboard. This will help you reach new perspectives on your impact.
Creating Valuable Reports
Let’s look back at the Social Media Analytics Cycle. Step 3 in this analytics process is reporting. After doing the initial data assessment and deriving aims for your social media marketing, you need to choose the right KPIs and subsequent metrics that really measure your goals.
You also have to think about who the audience of your report actually is. Are you reporting to your team members who need to know all the numbers? Or do you report to your management that is only interested in the most central KPIs? All this can be set up on a dashboard like quintly offers.
You can also then select a certain time frame for when your report is being sent out to the receivers. A daily, weekly or monthly basis can be sufficient depending on your reporting scheme.
What Makes Social Media Marketing Successful?
First and foremost: reflection on what you have done so far. Only if you know the impact of your social media content, you can then make informed decisions based on that data to create an optimal strategy.
To create an effective assessment of your social media marketing approach, ask yourself if you chose the right metrics to really measure what you are going for. Ask these questions on an ongoing basis, as marketing in social networks is a fast moving endeavor.
A well made and clear strategy that gets tested on an ongoing basis is the only way to have effective social media marketing and spend your resources right.
Additional resources on Facebook Analysis
Facebook Analytics by quintly
How to Analyze Facebook Reach
Average Interactions on Facebook: Industry Insights
7 Ways to Get More Facebook Video Shares
30 Biggest Brands on Facebook Analyzed
Have a look at our Facebook Reaction Study!

Join the conversation. Leave us a comment below!