
So, you’re enjoying increased sales and global recognition! To whom would you give the credit to? Definitely, your efforts! But just think what would have happened if there were no social media channels to help you promote your business? And what about Google Analytics that helped you all to measure your performance and traffic with social media tracking?
If you are SEO personnel, we need not to introduce Google Analytics to you. It is like your Mentor guiding throughout the entire journey of your successful or growing business.
Benefits of Google Analytics social media tracking
Google Analytics offers you data that helps analyze the source of traffic on your website and understand your visitors’ behavior. In addition, setting up your Google Analytics account to record and measure your social media initiatives helps you prove the ROI of social media adequately for your business.
The key to use Google Analytics social media tracking features is analyzing the most relevant social media KPIs (Key Performance Indicators), understanding ways to track them in the best possible way and then using the generated data to continuously improve your social media performance. Here are the eight important KPIs to measure your website’s traffic.
1. Overview Report
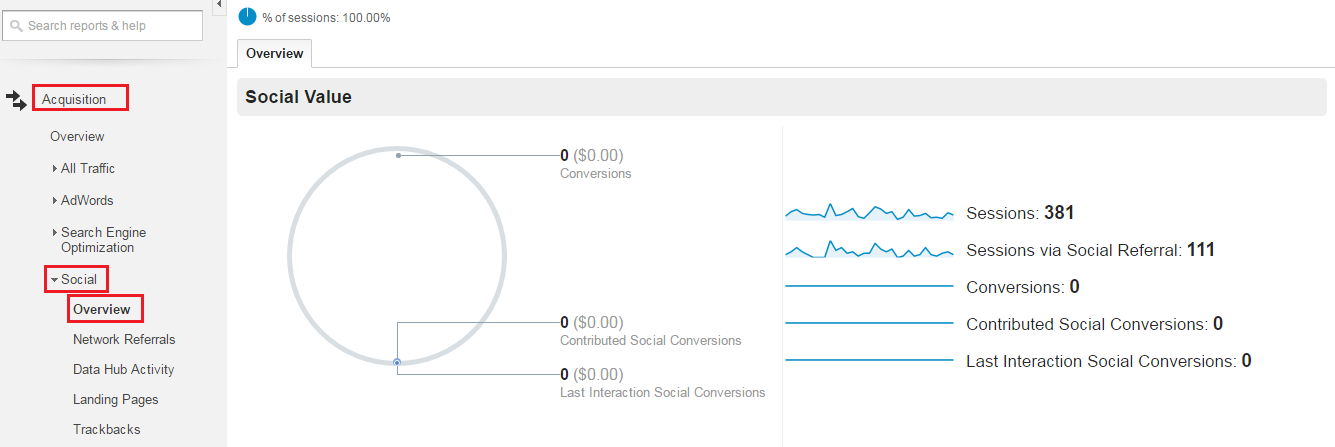
The overview report allows you to get a glimpse of how much conversion value is created from your social channels. You just need to go to your Google analytics account, click on Acquisition -> Social -> Overview and here you will have the Overview report. Please have a look at the snapshot below.
With this report, you get a picture of the top-level data for your site. It presents the report in graphical form, known as the ‘Social Value Graph,’ which compares the number and economic value of all goal accomplishments with those coming from social referrals. It also allows you to create a Social Media Dashboard in Google Analytics which can then be exported and distributed to other people in the business.
Use an overview report to keep an eye on the contribution of social traffic to:
- Sessions – Total number of sessions (the period for which a user is actively engaged with your website) within the date range.
- Sessions via Social Referral – Total number of sessions coming from the social referral within the date range.
- Conversions – The number of conversions occurred.
Last Interaction Social Conversion – These are the total number of conversions produced directly from a social media source. These visitors came to you and completed one of your goals within the same visit.
2. Network Referrals
As your content is shared and visitors visit your site, it's important for you to understand how the visitors from different sources engage with your site. So, if you want to measure the extent of visitors’ engagement for traffic from each social media source, seek help from the Network Referral report. This report will show you which social sites referred the maximum quality traffic.

3. Data Hub Activity
Data Hub Activity in GA was introduced to offer you with more specific information in a user-friendly way about what was happening with your content on social sites.
The Data Hub Activity report reveals what users are talking about you and how they are engaging with the content on your website through various social sites. This report shows the most recent URLs users shared, how and where they shared and their feedback or comments.
Google Analytics fetched all this information from the Social Data Hub. All the Social media sites send their activity streams to the hub which is then organized and presented in Google Analytics.
4. Landing Pages
The landing page report typically shows you what content worked on social media. It gives you the URL of the source page users landed on from social media. You can check which url post works well on which social media platform. This can help you build the content strategy for that type of social media channel. You need to click on the Secondary Dimension option and select Social Network. Please have a look at the snapshot below.
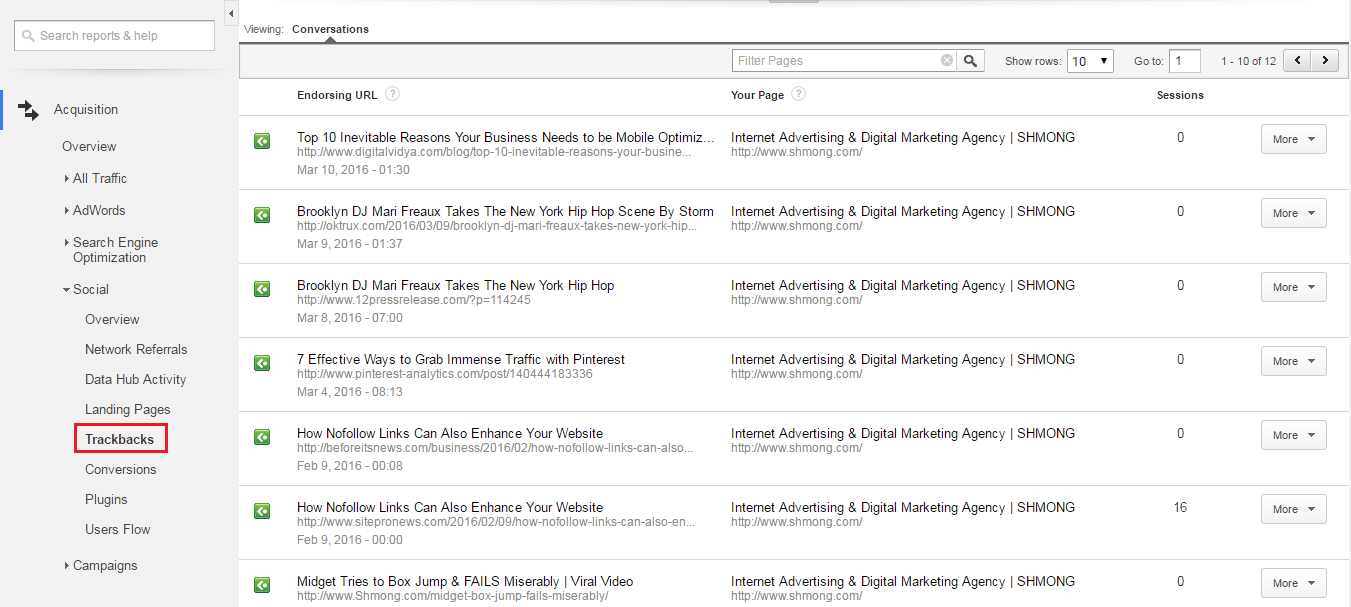
5. TrackBacks
TrackBack is a feature that sends a message from one website to another in form of a ping and is a form of peer-to-peer communication. TrackBacks is often used for informing a website that you have referenced in your blog or article. With a TrackBacks report, you can see which websites are linking to your content and in what context. This data can be used to replicate shared content and build relationships with those who regularly link to your site.
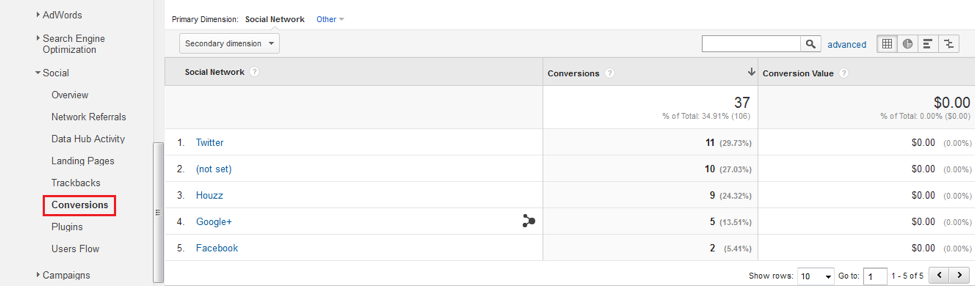
6. Conversions
To enable this report to work for you, you first need to set up your goals. This is because a conversion report gives you detailed information about your goal completions or conversions made by your visitors via social media.
With the conversion report, you can actually measure the importance of social media for your business. It helps you know whether or not your social media network is helping you drive your audience.
Conversions in Google Analytics will represent the total number of conversions and their monetary value that occurred from the social referrals. Furthermore, you can also filter the report to see conversion for specific goal sets. Simply, click on the button under “Conversion” to select which goals to display data for.
If you have set goal values, the conversion value will also be displayed, helping you to assess which social networks are adding the most direct value. If you click on Assisted vs. Last Interaction Analysis you can then drill down into which social networks are contributing to conversions where the social visit is not the last click. This can help with your attribution analysis.
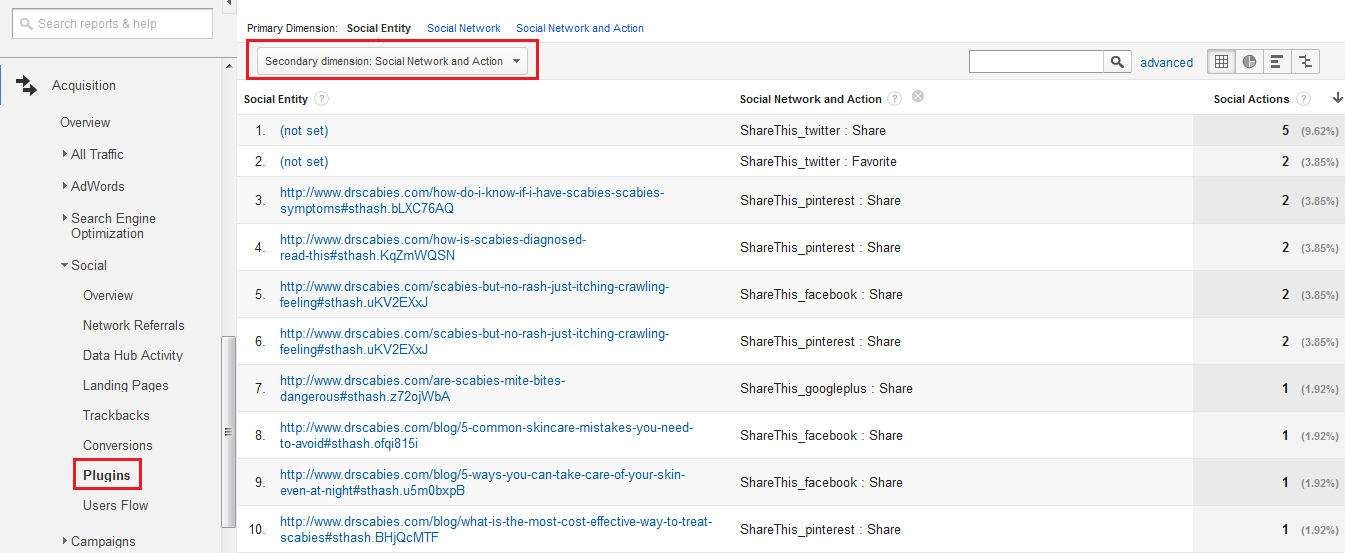
7. Plugins
If you have a social share button on your site, it is important for you to know which of them are being clicked often. With a plugin report, you can see the number of times visitors have used the social bookmarking buttons on your site and the pages that were shared the most. This report helps you to know the interest of your visitors that what type of content is being shared by them mostly.
One key thing to note here is that by default, Google Analytics will display data for the Google +1 button only. Hence, to enable buttons for other social media sites, you need to add additional tracking code to your website. To learn more about this, just head over to the Google Analytics Help Center.
8. Users Flow
The Users Flow presents a detailed report showing the initial path your visitors from social networks took through your website. For instance, if you have organized any campaign to promote a specific product, the User Flow report can help you see whether visitors from each social network arrived at your website through the product page and if they further continued to other parts of your website.
A user flow report points to the following aspects:
- Know the traffic flow from each social network source and the behavior of the users on your site.
- Highlight traffic flows through particular landing pages to see the progress of your content strategy towards driving social traffic.
- Highlight the exit points and to determine the significance of the relevant place for people to exit, and how the page is performing.
Conclusion: Optimize your campaigns with social media tracking
Monitoring each and every step towards success in the Social World with Google Analytics social media tracking is very important for businesses to enhance their brand recognition, traffic and return of investment. We hope this guide to keep a check on your optimal success tracking of social media in Google Analytics will help get you started on the right path to proving your social media return of investment.
Join the discussion on social media analytics on Facebook or on Twitter.

Join the conversation. Leave us a comment below!