
The New York Times is one of those iconic publishers that practically everybody knows of. So we assume that their social media marketing is just as iconic as the content of their magazine. Therefore we analyzed four of their Instagram accounts from the past 9 months to gain a behind the scenes view.
Instagram analytics keeps getting more interesting as the network develops. Instagram launched a bunch of updates in the past three months and changed their algorithm so that users face more clutter. Users need more scrolling if they want to see all the content from those they follow. Furthermore businesses need to keep in mind that their uploads might reach only a fraction of those they reached before. The Social Media Marketers of the New York Times reacted to the change and were able to engage their audience even more than before.
Hashtag following was one the biggest changes on Instagram in December. The change puts pressure on marketers to know which hashtags can create higher visibility for them, as the cluster of algorithm changes reduced organic reach.
We analyzed four different New York Times’ Instagram accounts (New York Times Fashion & Style, - Travel, - Food and - Archives) under examination to see if data will reveal new trends in the behavior of its users. The data analyzed is from between 05.14.2017 - 02.14.2018.
Data Surprised and Turned Over My Expectations
As Instagram is growing, so is the competition for engagement. I expected to see descending development in the engagement rates as well. Average Interactions Per Post metric revealed the opposite of what I was expecting to find.
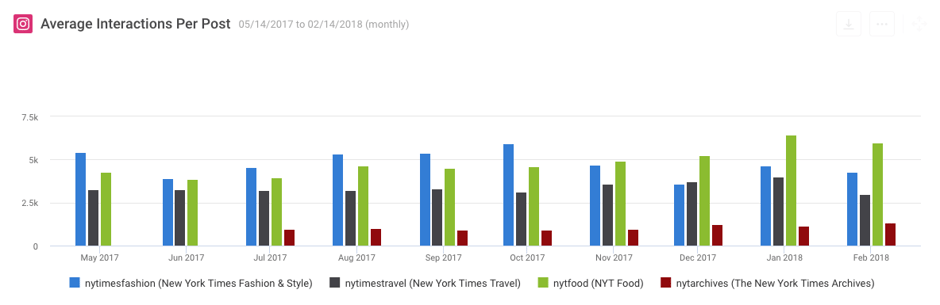
All accounts show more or less of growth in the engagement. I was confused, as all the accounts have kept their posting schedule same during the analysis period. Nearly all metrics showed very little change from the first months of the analysis. I wondered this out loud and one of my colleagues got me to realize what might be behind the higher interaction rates.
My colleague follows the New York Times Food Instagram account and told me that they use the stories feature frequently. The new Instagram algorithm prefers content that keeps users engaged with the platform, hence uploads that stop users scrolling, (live) videos and stories. So their effective use of Instagram stories might be the reason for people also interacting more with the rest of their content.
Use Seasons and Timing Effectively
Holiday marketing is news to no one, but some industries have clear seasons when everyone is particularly alert. The fashion industry is a great example of this, and the New York Times Fashion account is clearly aware of how to promote their content during the hot period of time. From the graph below, anyone can spot the New York Fashion Weeks at a glance.
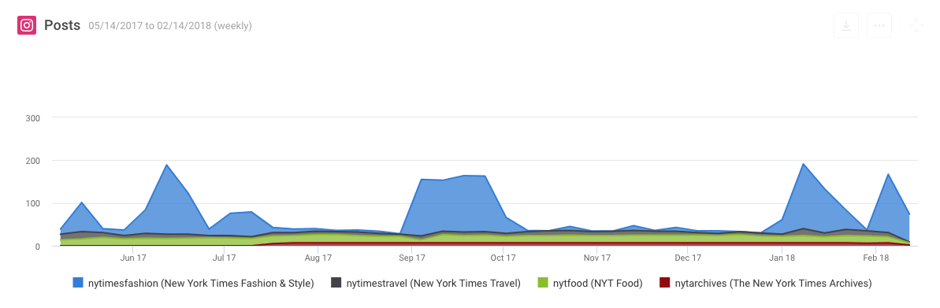
When you have the big picture figured out, analyze the best time to post to reach as many of your followers as possible. The charts below show, that even though they publish plenty of content, the New York Times Fashion is not utilizing their highest interaction peaks.
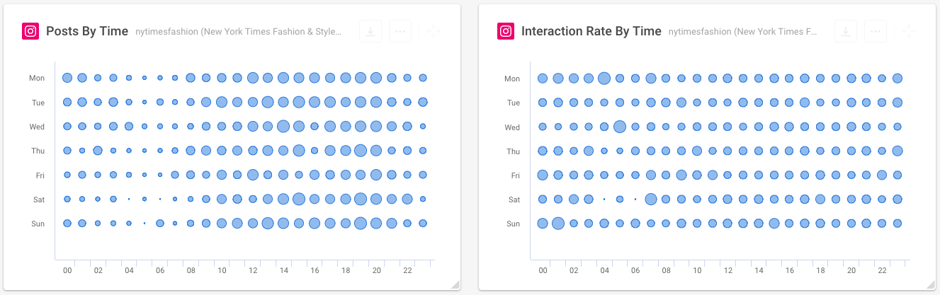
With social media analytics tool like quintly, you can easily verify the optimum time for you to post to any social network. Check every now and then your followers' behavior on Instagram to ensure best possible Instagram Marketing.
Hashtags Provide a New Way to Be Discovered
Hashtags have changed over time in Instagram. Remember those days when no one really knew how to use hashtags and many wrote sentences using hashtags? Today, with polished social media presence and professional Instagram Influencers hashtags matter too.
With the possibility to follow hashtags, businesses can create higher reach by analyzing their hashtags. Hashtags creating most interaction for all the New York Times accounts are #annawintour #Halloweekend and #chocolatecake. From more common hashtags #NYFW creates high interaction and is used often.
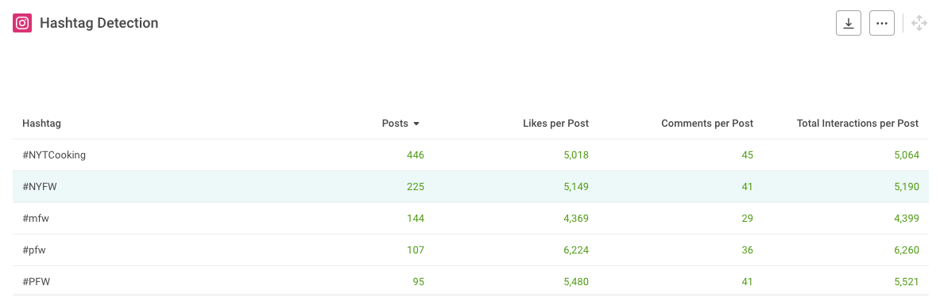
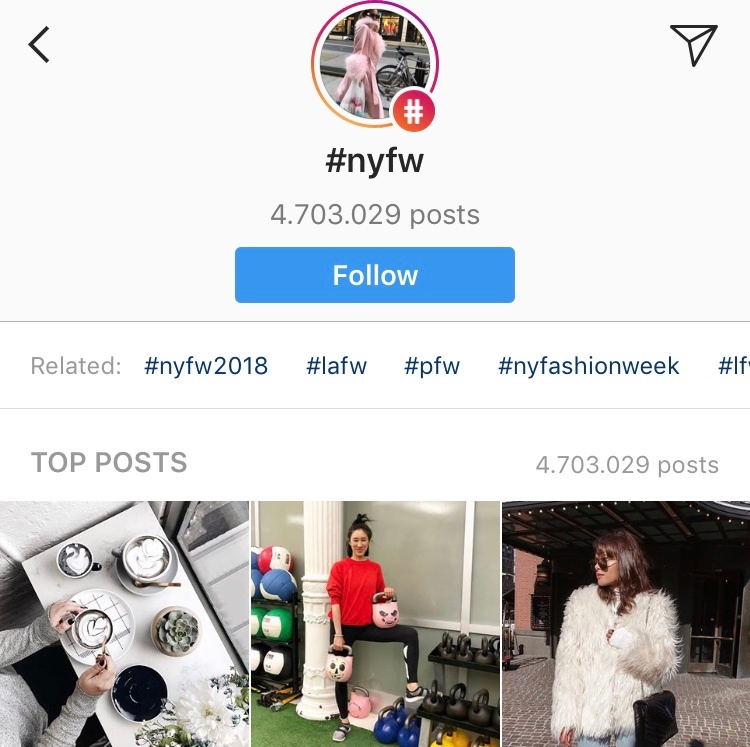
When a user searches for images with the hashtag, they are likely to see also New York Times Fashion account. If they follow the hashtag, uploads with #NYFW pops into their feed. Putting thought into your hashtags can enhance your reach greatly. Well-performing hashtags open new channels for businesses to appear in.
Marketers Takeaway
Keep yourself on top of Instagram updates. Major changes can leave your business behind the competition if you don’t adapt. New York Times is a great example of keeping up with the development and creating continuous growth by adopting new features into use.
When I started to write this article, I thought I would see descending numbers, the data reminded me those general assumptions do not lead to correct analysis, data does.
The irony in gaining visibility and engagement is that you have to create engaging content. When you are able to catch your followers' attention, they are more likely to see your content again. Be sure that your content is also timed optimally, to reach your followers best.

Join the conversation. Leave us a comment below!