

We’re excited to announce the launch of our new feature, Snapchat Story Studio Analytics. It enables you to gain deep insights into the performance of your content.
After daily active Snapchat users decreased by 5 million in 2018 (186 million users in Q3 ‘18), Snapchat is now back in the game with 203 million active users daily.
This growth could’ve been triggered by the release of the face filters that went viral and the optimized Android version, as well as the introduction of Snapchat Shows at the end of 2018.
Snapchat Story Studio - what it’s all about
In Snap Inc.’s Story Studio, publishers are able to design and upload Snaps, Stories and, if they are a premium content producer, also Shows. This content can later be found in ‘Discover’ or – when it comes to ‘Shows’ – also on the publisher’s Profile Page.
Snap also offers their own analytics solution within Story Studio.
Snapchat Shows
Now what exactly are Shows and what’s the difference with regular Stories and Snaps?
Let’s take a short trip back to October 10th, 2018, when Snapchat announced Snap Originals – exclusive Shows that are available on Snapchat only, created by chosen producers.

After a while, Snap took on board selected premium content producers as their publishing partners, who are now regularly creating their own Shows. Amongst them are media companies like Hearst, Conde Nast, Refinery29, Lonely Planet or BuzzFeed.
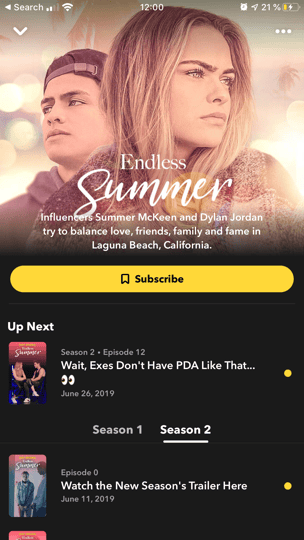
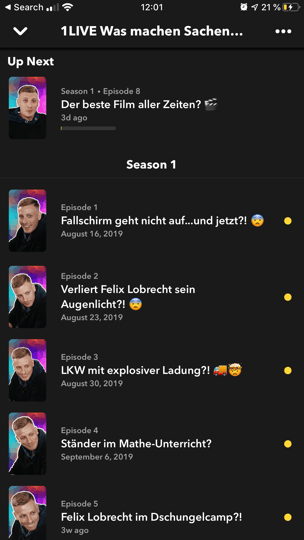
Snapchat Originals, as well as Shows, appear in Discover and also have their own Show Profile Pages on which the user can browse through the available Shows, Episodes and also Snaps.
And that is exactly the difference with regular Stories – every Snap of every Episode of every Show is accessible at all times on the Show’s profile page. This also means that Show content does not disappear after 24 hours like regular Stories do.

What about you?
Are you a publisher and do you have access to Snapchat Story Studio? Then we have great news: you can now analyze all of your data to the core with quintly and take your Snapchat strategy to the next level.
We are the first third-party analytics solution that will give you access to every available metric to analyze the performance of your Snapchat Show and Publisher Stories.
Let’s see how that can be of benefit to your Snapchat strategy.
How quintly’s Snapchat Story Studio analytics will help you take your content to the next level
You’re investing a lot of resources for the production of a Show or a Story, right? But what kind of content does actually perform well and to what kind of Stories and Snaps are your viewers most attracted to?
With Snapchat Story Studio Analytics you’re able to gain deep insights into every Show, every Story within a show and every Snap within a story.
You can break the analysis down to every piece of content you put out there – and you can even compare them to each other.
This way, you’ll be able to understand your audience in a much deeper way - who are they, what kind of content do they like, what topics are they most and least interested in?
You can keep working on Shows and Stories that work well and not waste time on producing content that users don’t seem to adopt very well.
With all of those insights, you’ll be able to adjust your strategy accordingly. With such knowledge about the preferences of your users, you can create even better Shows.
Let’s head to the facts
With quintly’s Snapchat Story Studio Analytics you’re able to use a huge variety of metrics to track and compare the performance of the Snapchat content you create as a publisher – from every single data point that is available in Snapchat Story Studio.
We are able to break the data down on:
- Show metric level
- Story metric level
- Snap metric level
Here, you can access various important data points and are able to track:
- Key Metrics for Top Episodes/Stories and Snaps within Stories and Episodes (such as Completion Rate, Drop-off Rate, Reach, Shares and many more)
- Demographics (Age, Gender)
- User Loyalty
- Reach Funnel
- ...and much more!
Sneak peek into our metrics
Now let’s find out what these metrics look like. We’ll give you an overview of 5 of our 19 metrics available in our Snapchat Story Studio Analytics:
Snapchat Monthly Uniques Over Time
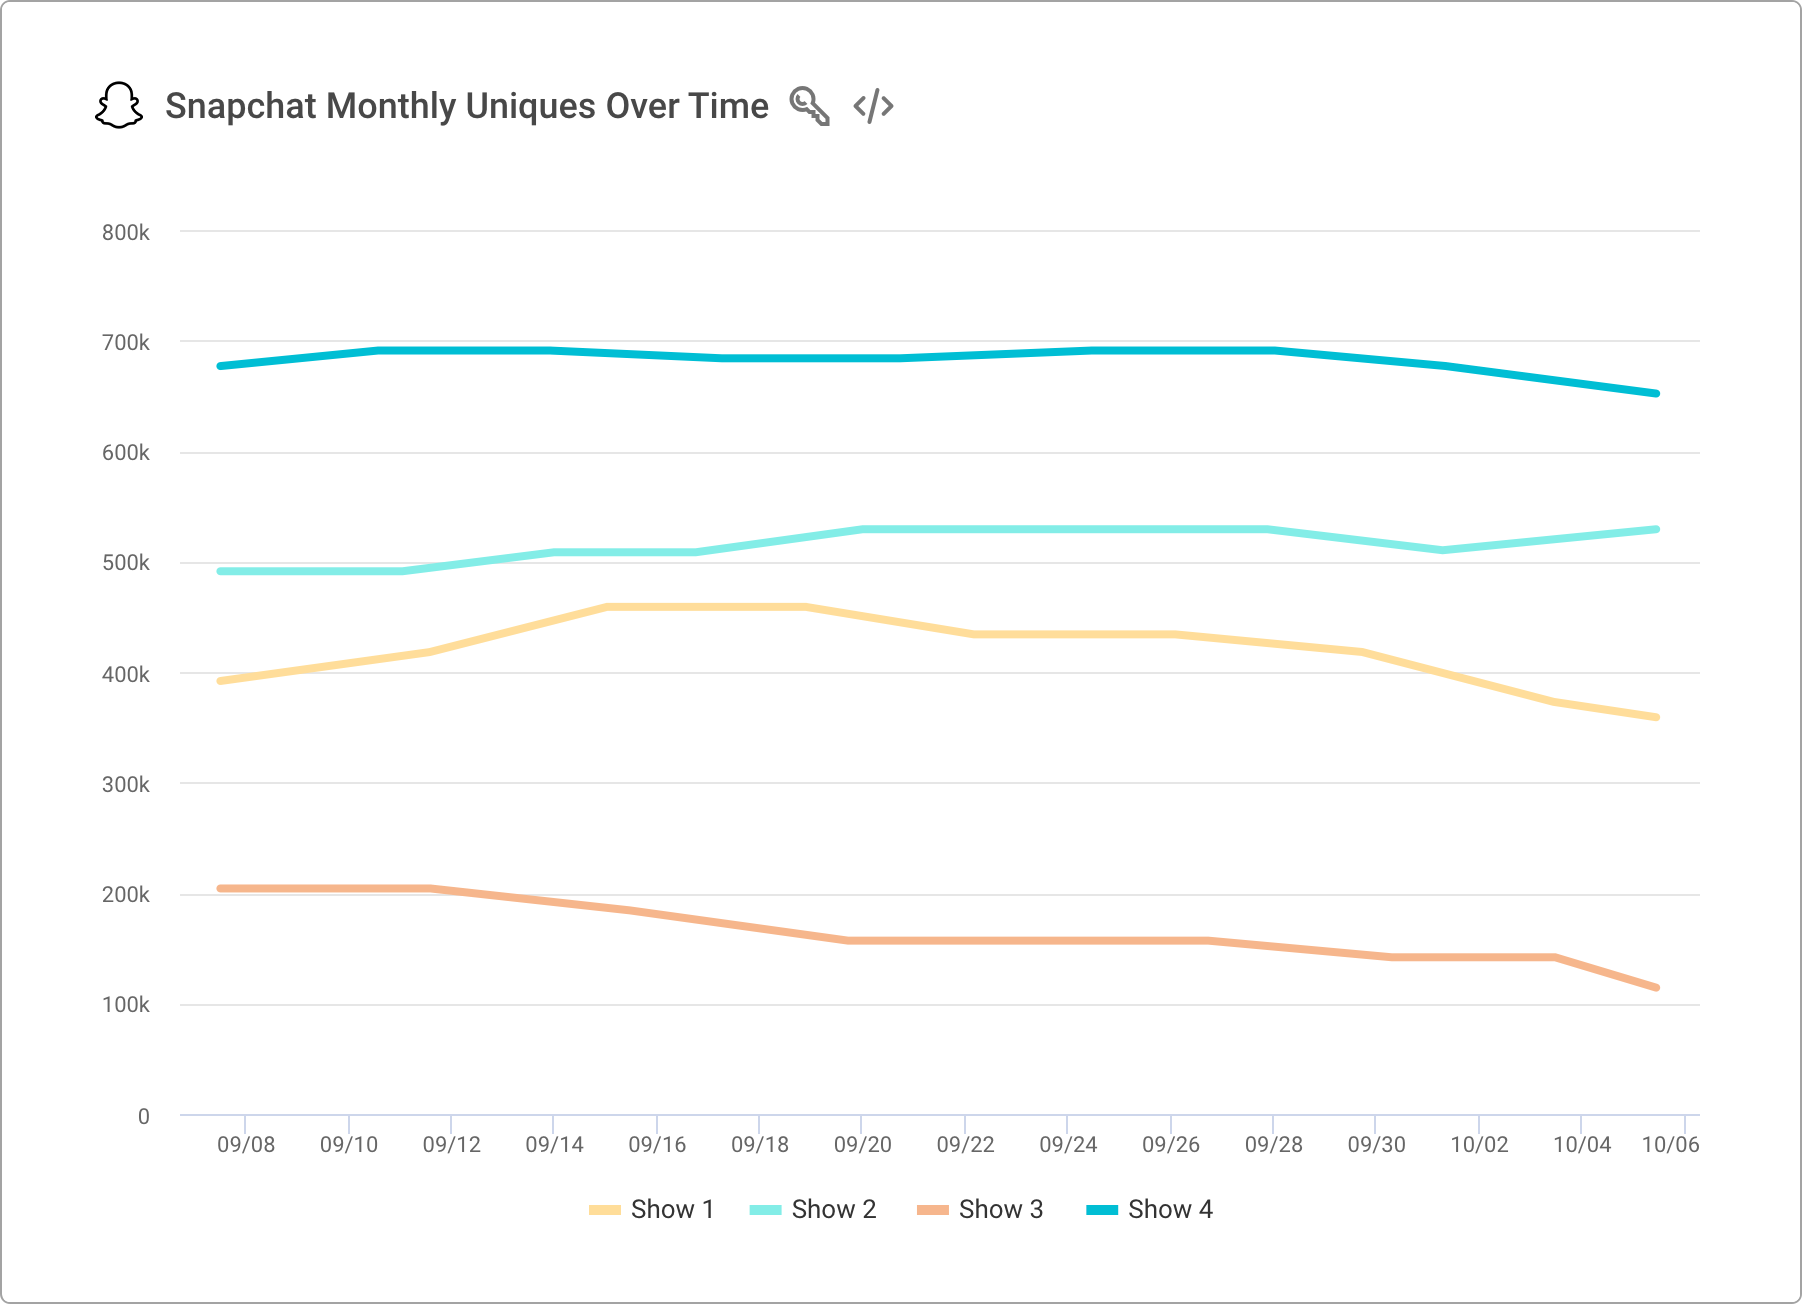
This table shows how the number of monthly unique users develops over time per Snapchat show. Discover if your shows are maintaining their success over a chosen time period. You can also compare the performance of different shows and see which one is your most successful.
Show Gender Demographics
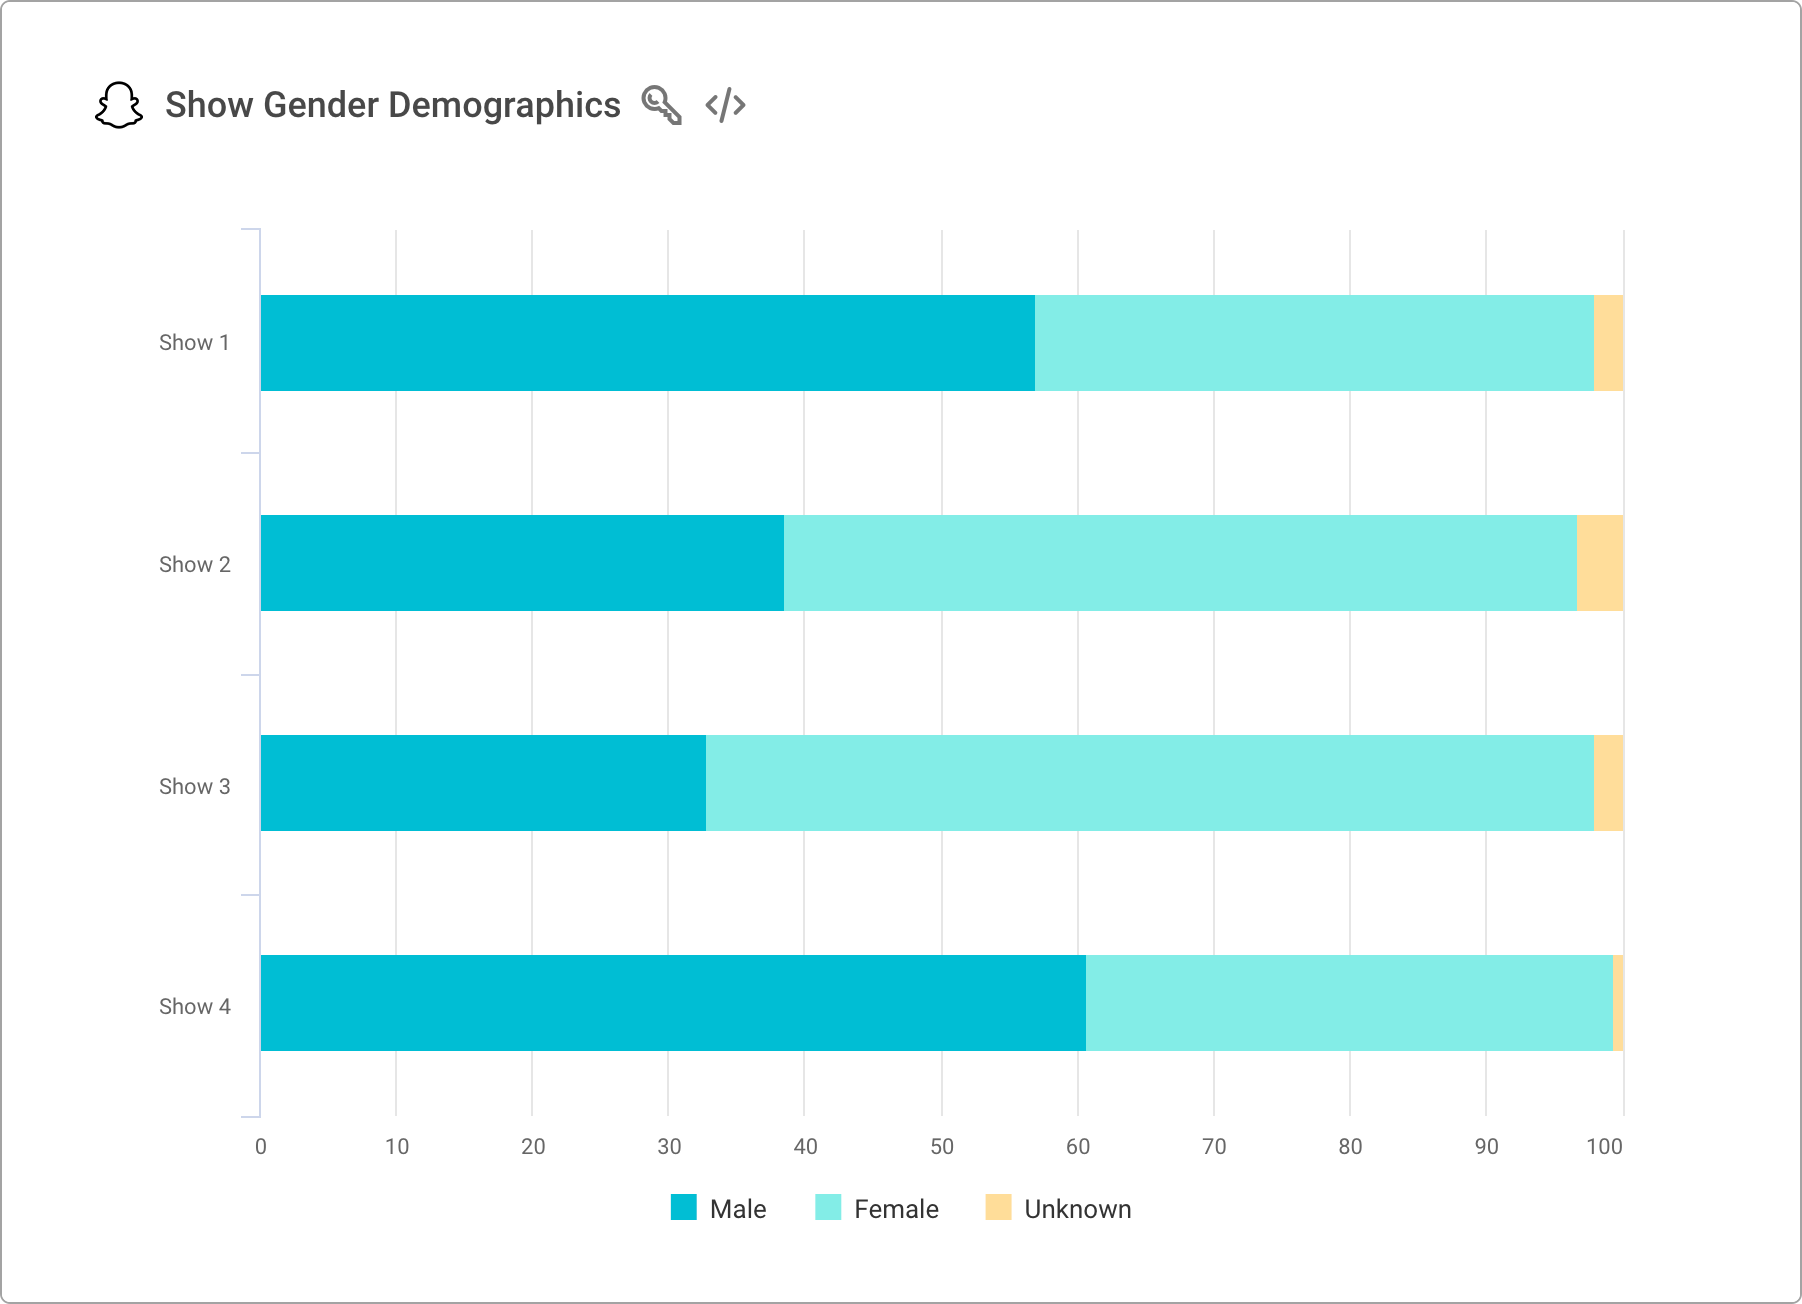
The Show Gender Demographics table lets you analyze the number of users who watched a show by gender – this can be female, male or unknown. You can, again, compare the data of all of your shows in one place.
Snapchat Top Episodes/Stories
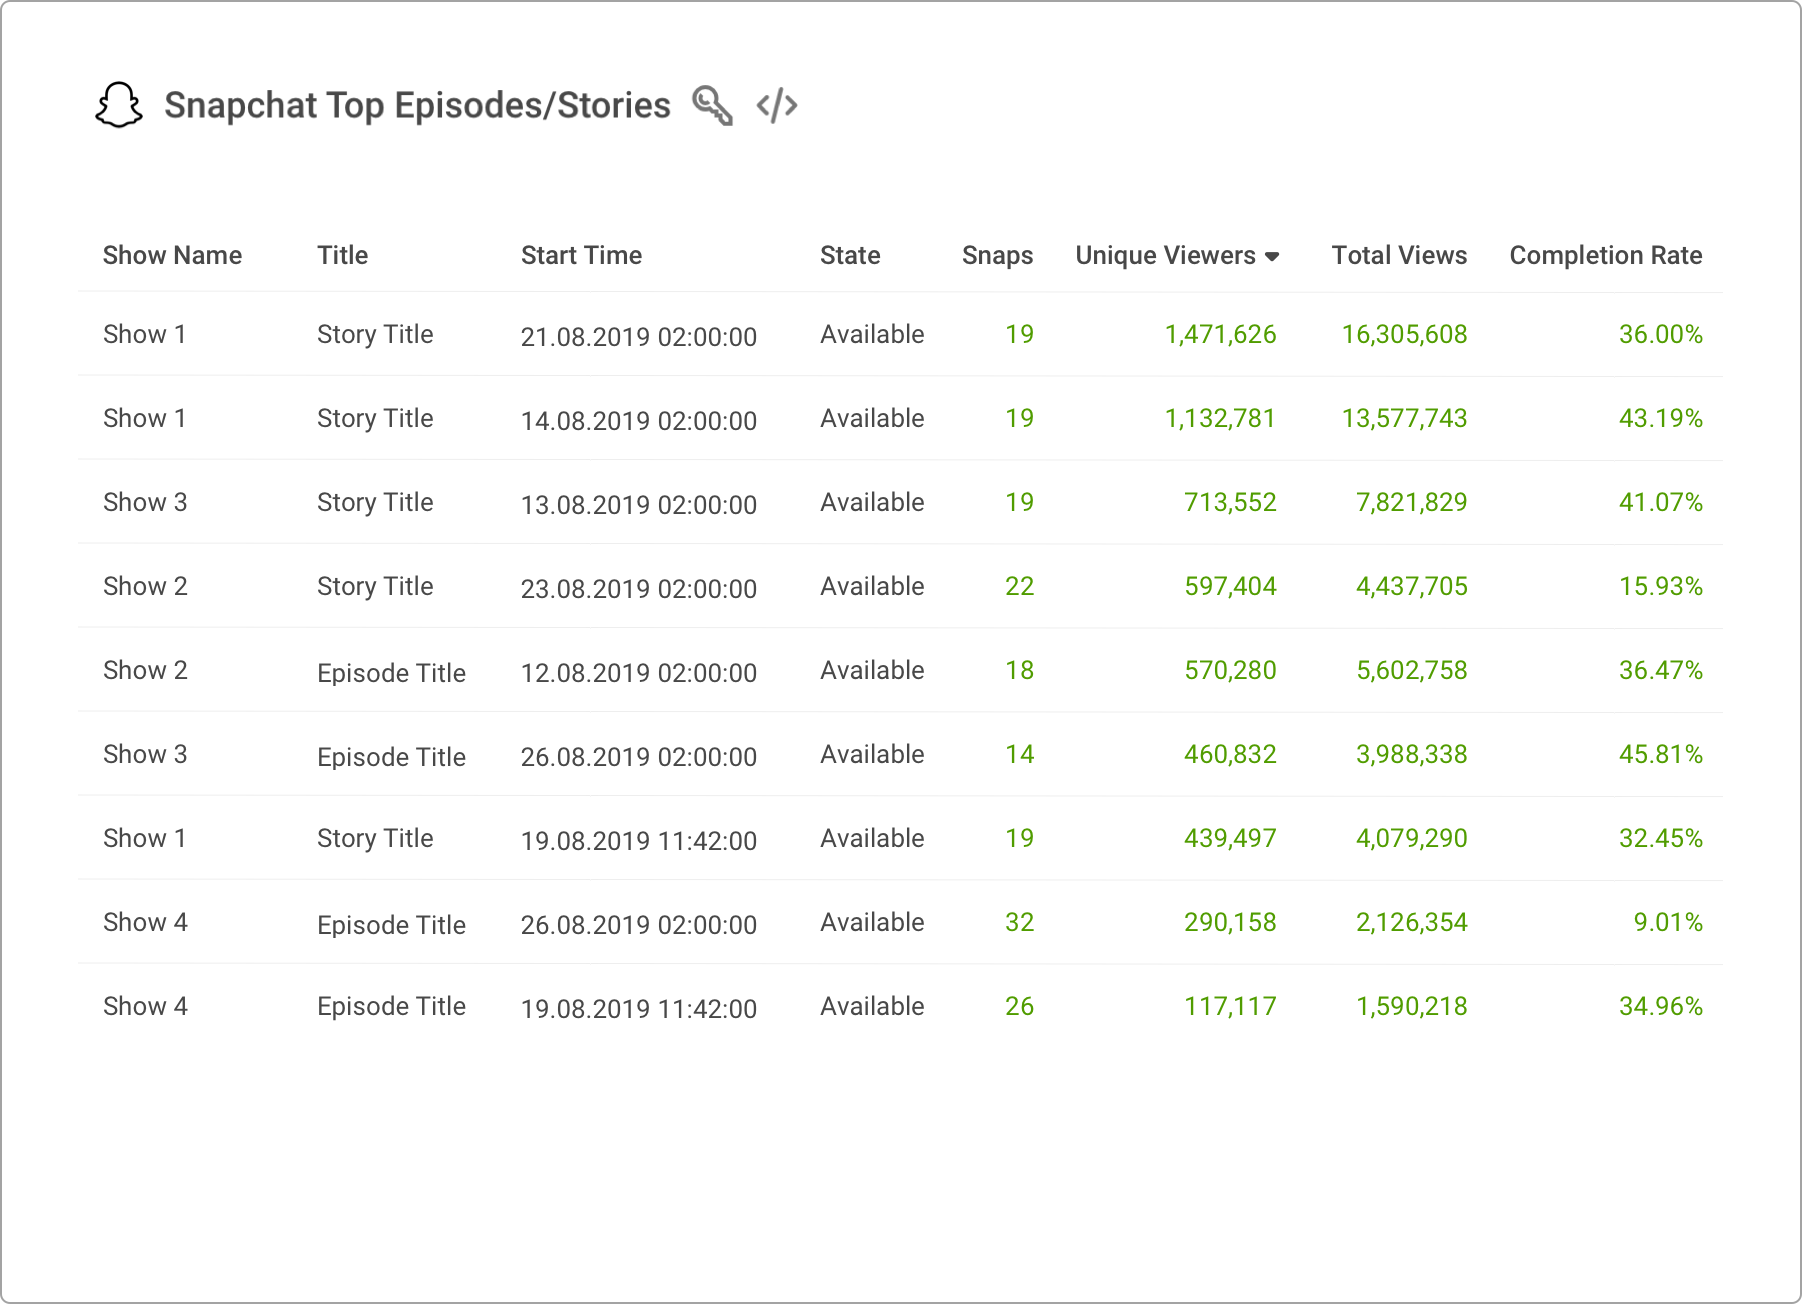
This table offers you an overview of all the Episodes that you published in a given time frame. By displaying unique viewers, total views and how many users have completed a story, you’ll get a quick and easy overview of the performance of every Episode of your Shows or every Story you publish.
Snapchat Top Snaps within Episodes/Stories
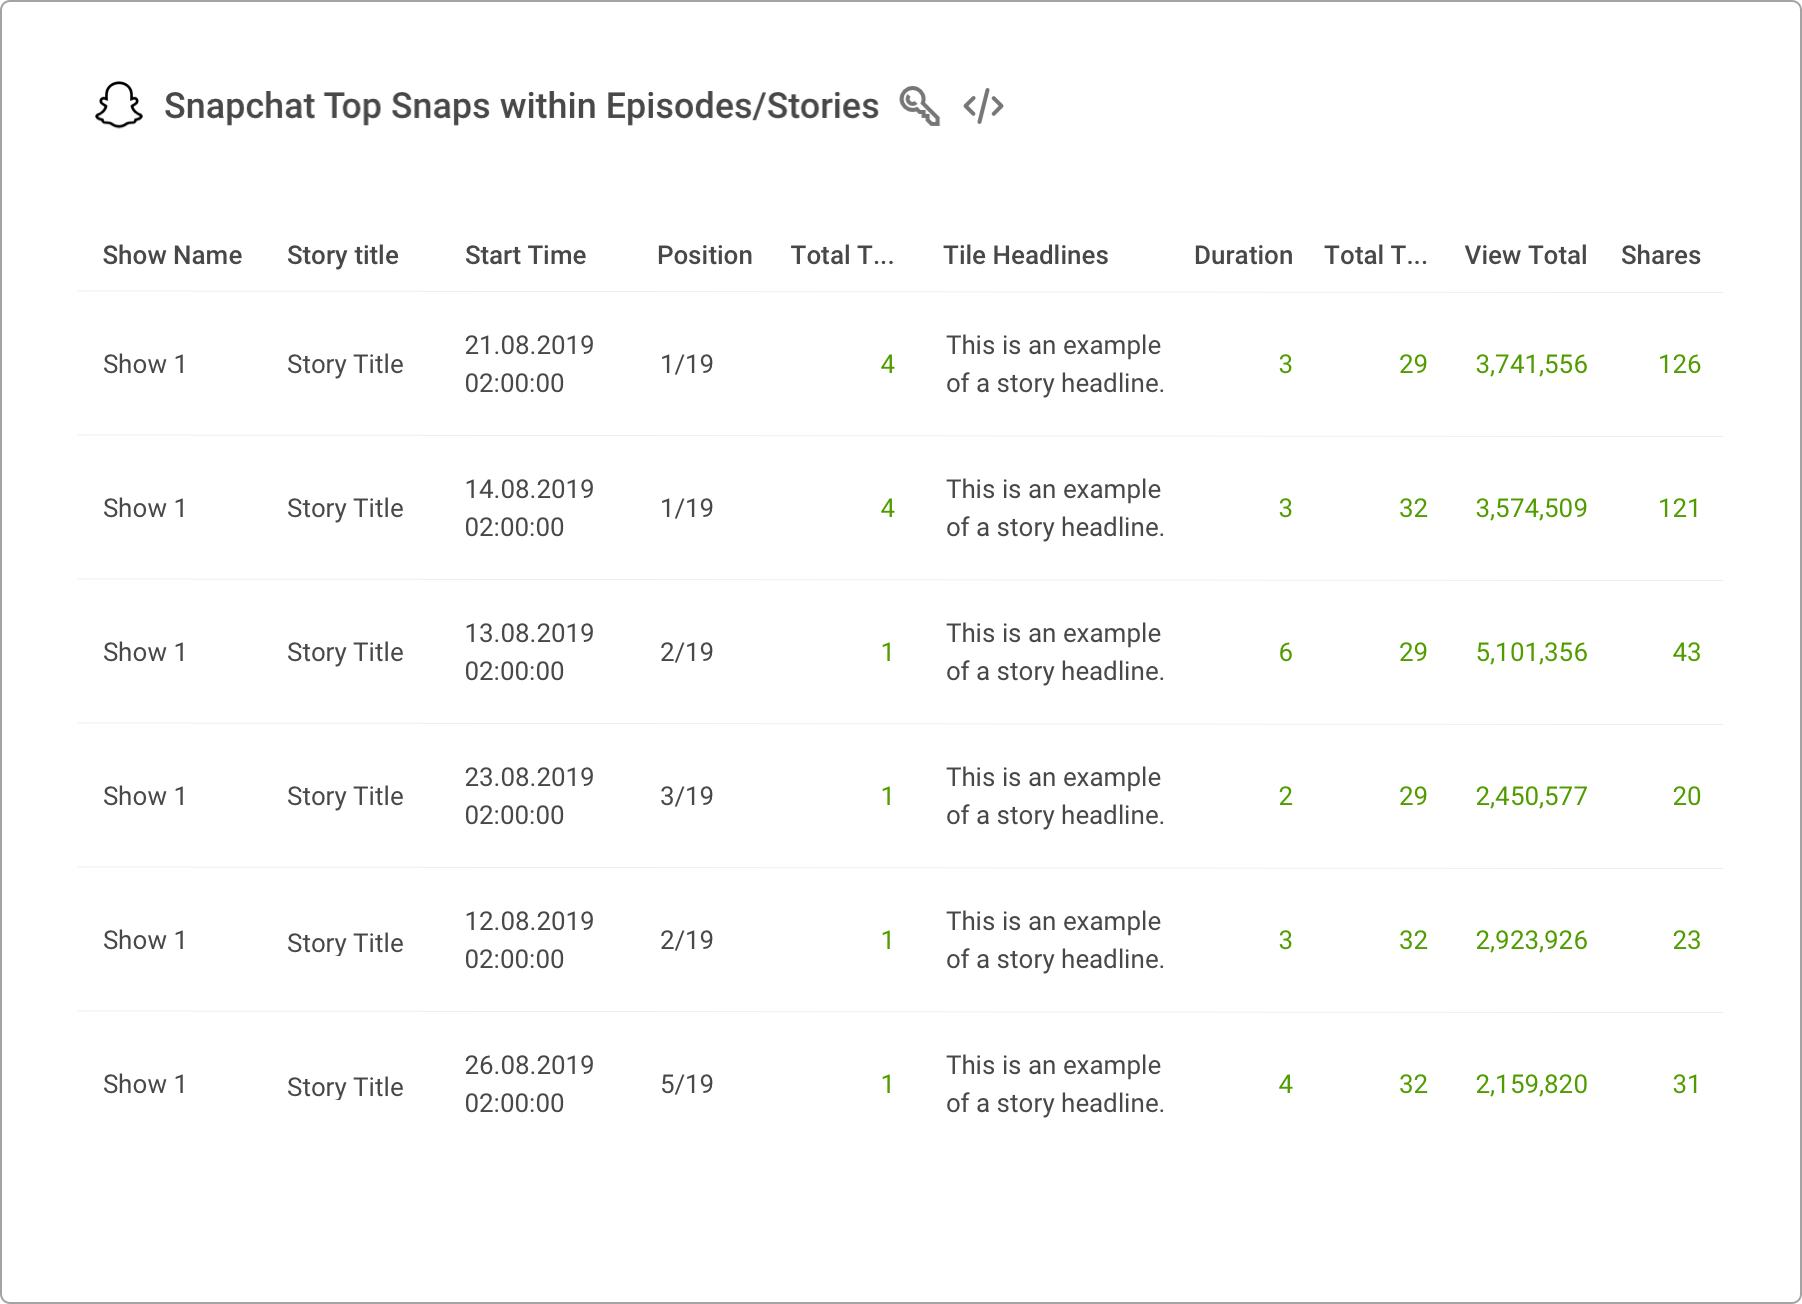
The Top Snaps within the Episodes/Stories table provides you with an overview of the most important data points of your Snaps within Episodes (the same table is available for Episodes) For a selected time frame, you can analyze your average performance for every content piece. This makes fast benchmarking of different Snaps and Episodes possible.
Showing crucial information on their performance, like the drop-off rate, shares, screenshots or view times, you can easily identify your most successful content, measured by several central indicators.
With these insights, you are able to analyze every Snap within every Episode and Story. Which Snap or Episode was worth watching until the end and which was interesting enough for your audience to share it with their family and friends?
Snapchat Episode Unique Viewers Funnel
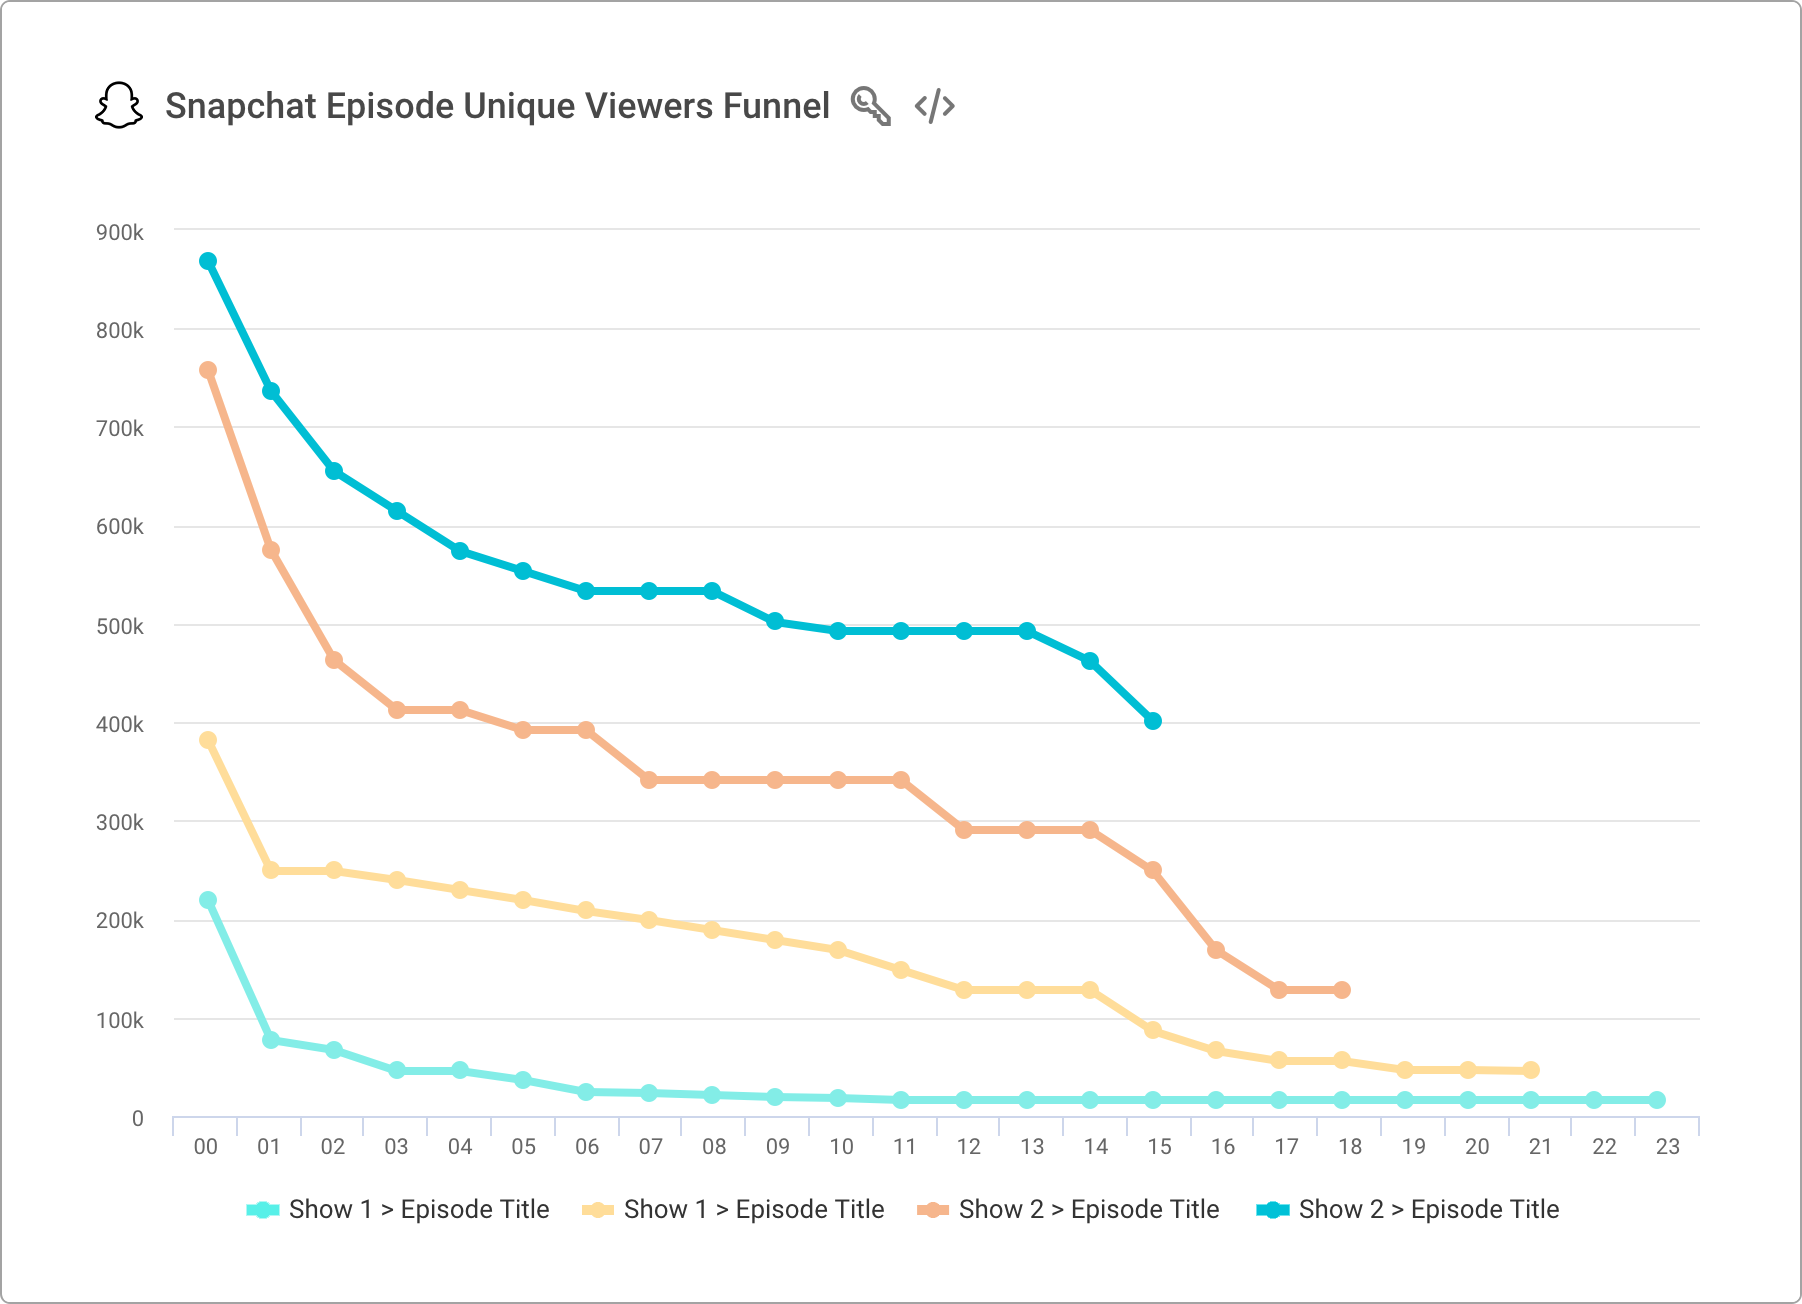
This table shows how the number of unique viewers develops for each episode of the shows selected. You can basically discover which of your shows maintain their success over a chosen time period and thus, which show is well perceived amongst your audience. If the number of unique users is dropping, you may have to think about putting more effort into promoting this particular show, or analyze the show and make some changes within the content creation
Gain better insights for your Snapchat content
Our clients stand at the center of what we do. With Snapchat Story Studio Analytics, we enable quintly users to get much better insights into how their Shows, Stories and Snaps perform, thus enabling better data-backed decision making. The metrics presented in this blog post should give you a first overview on how content you create within Story Studio can be analyzed.
Do you have questions about the set-up process or other specific questions? Just write an email to support@quintly.com and we’ll be happy to help!

Related articles
40 social Media buzzwords every marketer needs to know
How to keep your social media channels engaging for your followers
5 reasons why you should use social media to connect with your customers
How to integrate social media data and avoid data silos
Identify social media trends in an ever-changing marketing world

Join the conversation. Leave us a comment below!