
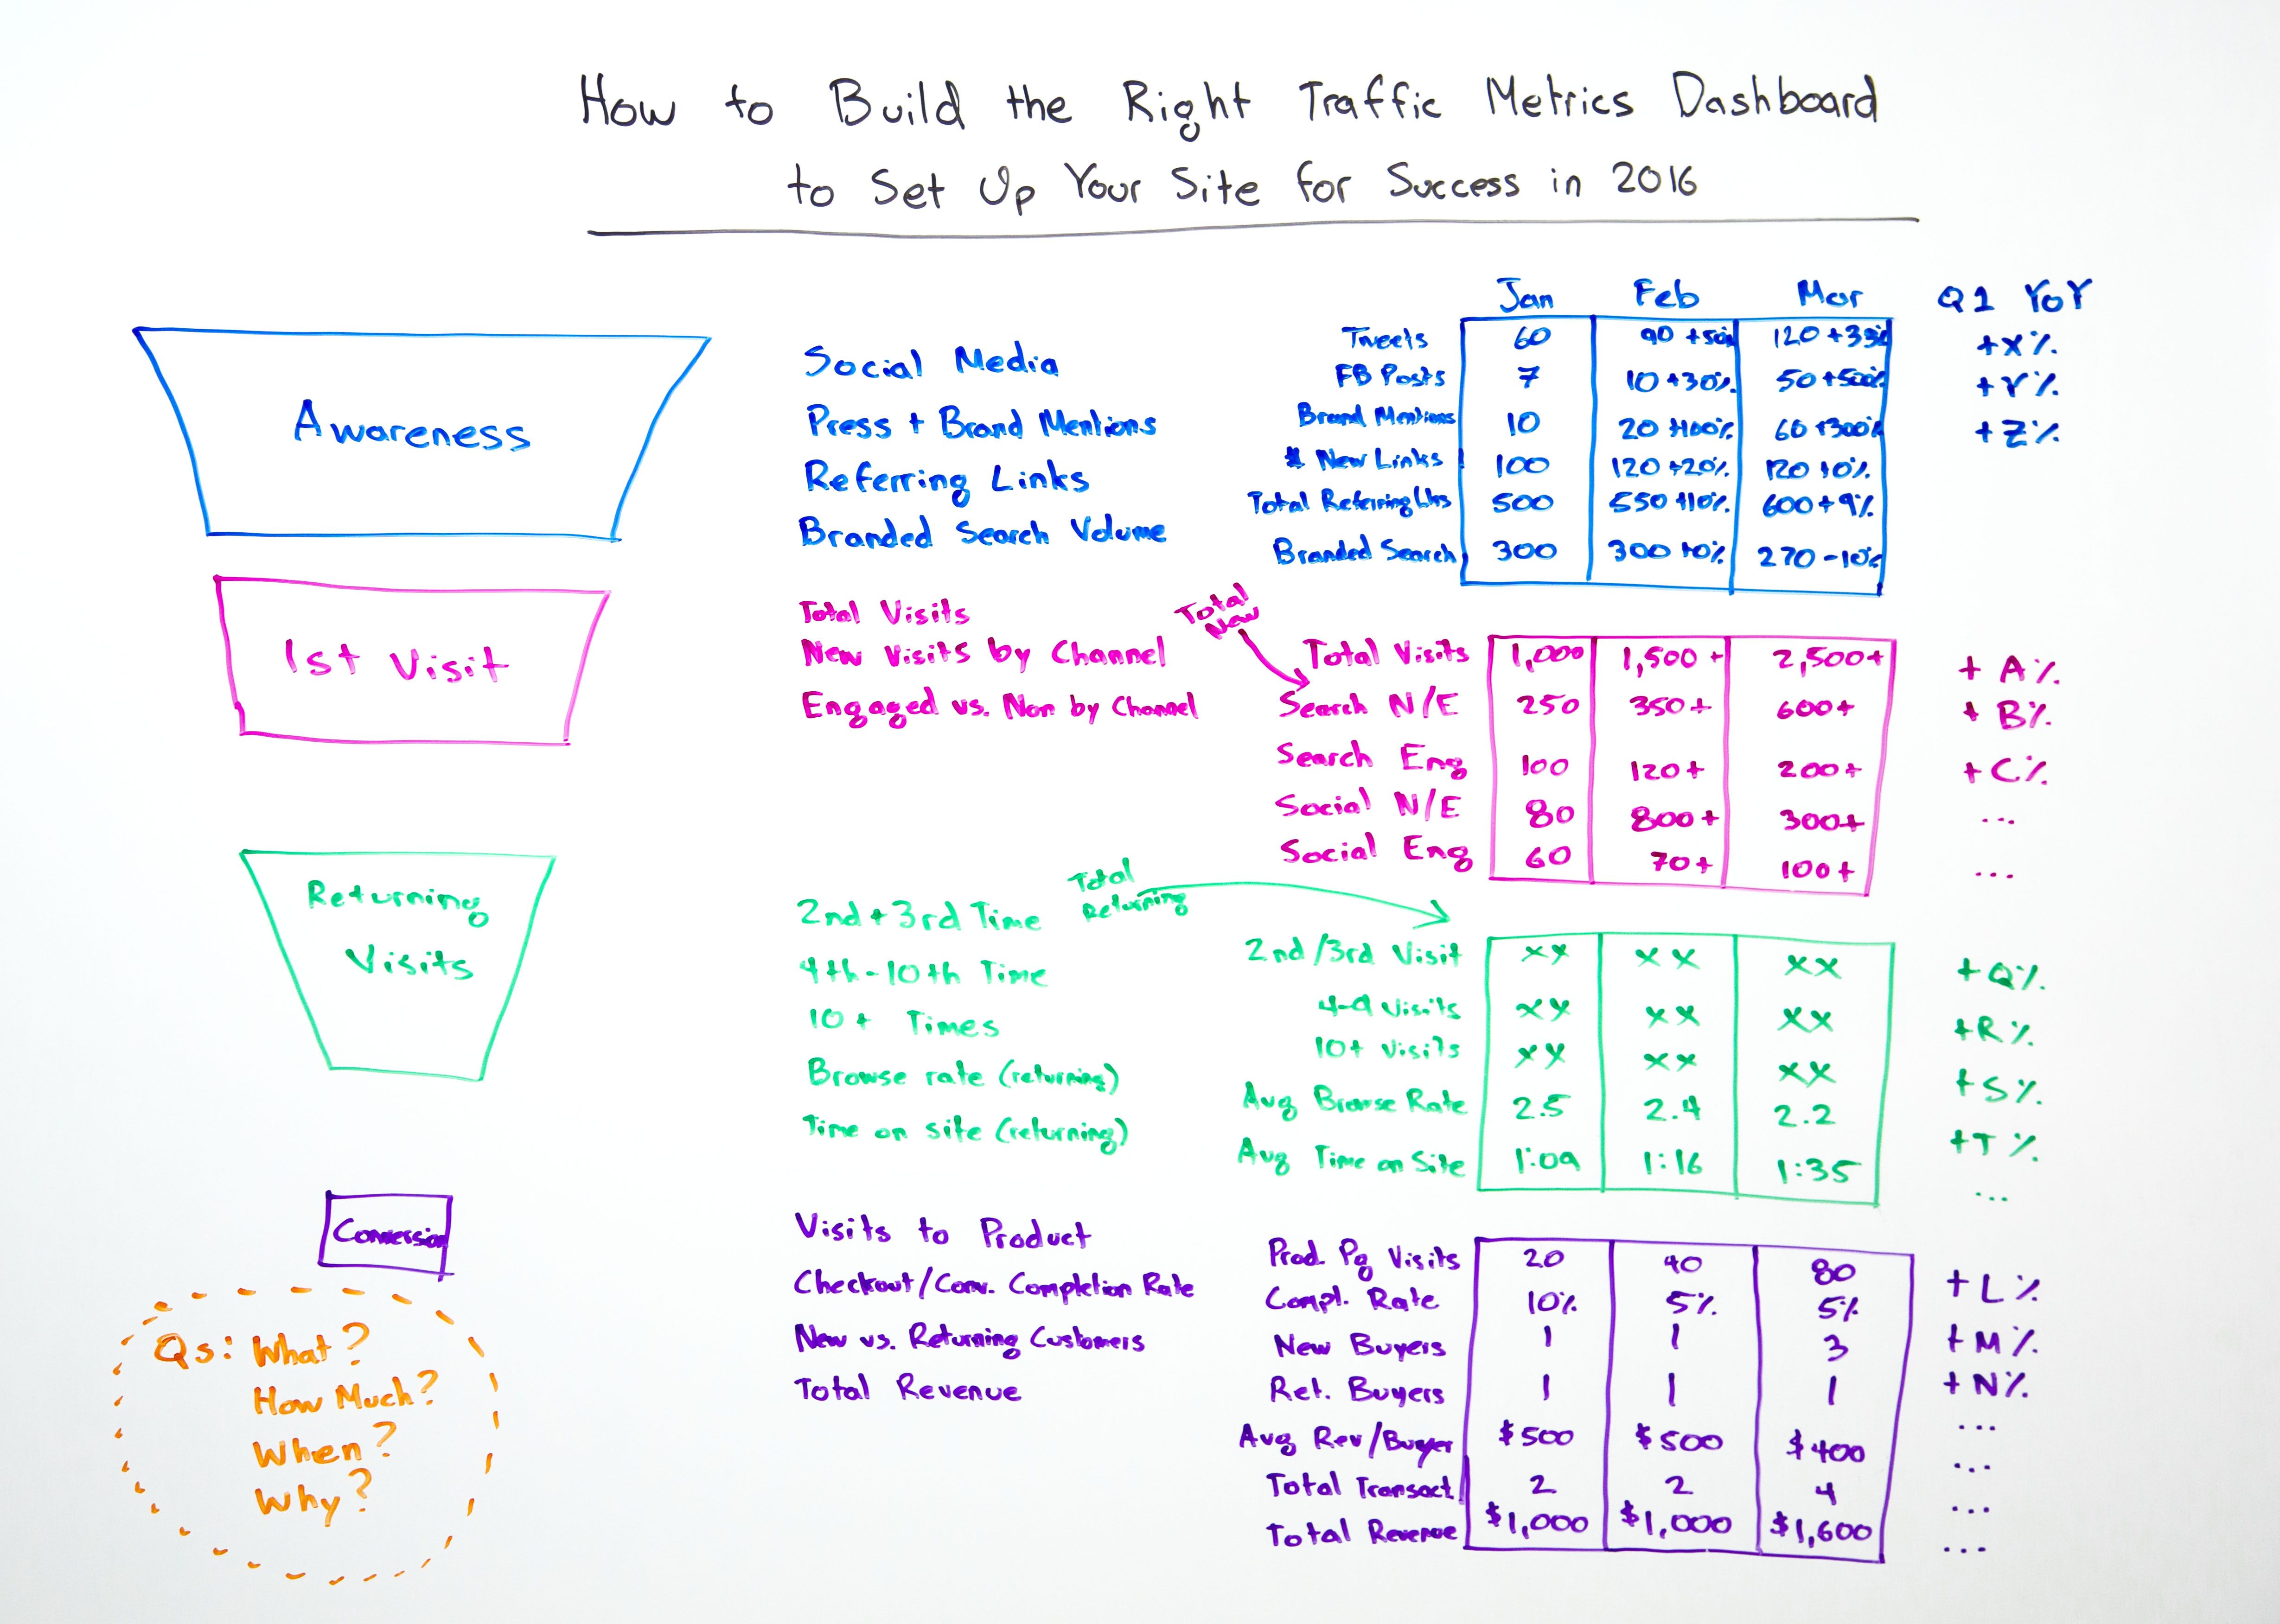
Klipfolio, a leader in the cloud-based business intelligence dashboard market, has recently launched native quintly integration. It is thus possible to incorporate our data into comprehensive Klipfolio dashboards. The Canadian company has recently launched a dashboard based on social media guru Rand Fishkin’s recommendations for 2016.
Rand’s dashboard already offers a very good overview of the most important social media KPIs. One part of it are metrics that he summarizes under the keyword ‘awareness’. In this post we want to present a couple more metrics that can be used on top of the ones used by Rand. These will enable you to understand the awareness for your social media profile even better.
Awareness metrics for your dashboard
So in this article we want to present six useful social media KPIs that will help you understand the performance of your social media profile better. Based on your findings, you will be able to optimize your campaigns. We will explain the Fan Change, the Overall Interaction Rate among different networks, the Average Interactions per Post, the Interactions by Post Type and Key Influencers.
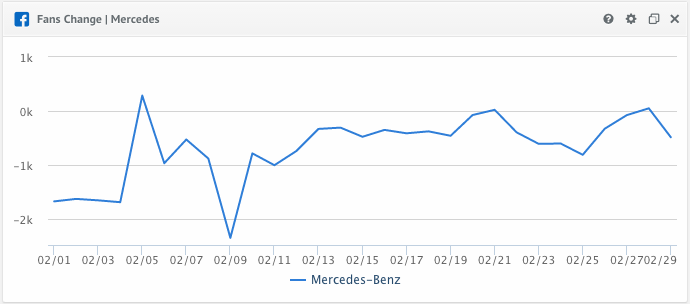
Measure your Fan Change
The Fan Change metric helps you determine the total fan change of your analyzed profiles on a daily, weekly or monthly basis. It shows the total number of how many followers you have gained or lost, so it can be either a positive or a negative number. With this metric you can - for example - explore how a certain campaign affected your change in followers. The Fan Change is also available for other networks like Twitter and Instagram. Besides it, there is the option to show the fan change as a standardized rate that makes it easy to compare to other social media profiles of different sizes.
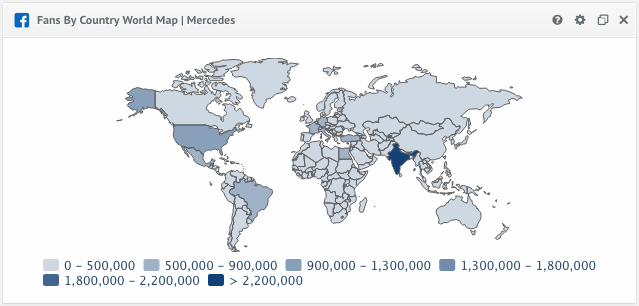
Track your Fans by Country World Map
This metric with a map view enables you to show the fans of Facebook pages by country of origin. For single profiles Facebook usually gives back the numbers for the top 45 countries. In consequence, there might be a slight difference between these numbers and the fans total value. If you use this metric with a group you will get the accumulated values of all Facebook pages in the chosen group. Moreover, you might even get the numbers for more than 45 countries. The metric can be crucial for finding out the most relevant countries if you run the profile of a global brand. You can also set up a world map for your competitors and find out what their most successful markets in social media are.
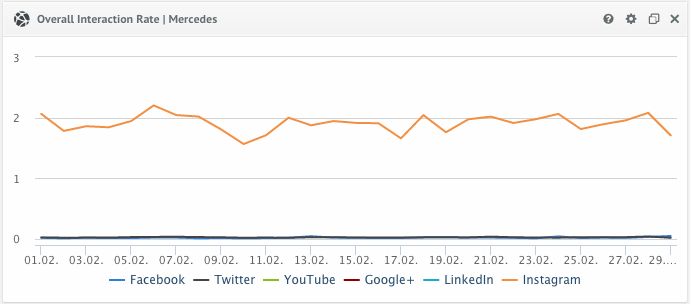
Find the best performing Network through the Overall Interaction Rate
This metric gets a bit more complex but can give you a deeper insight into the engagement on your profile. It shows the interactions of a Facebook page irrespective of the amount of the fans. The result is a combined index of the sum of likes, shares and comments per own post, standardized by the total amount of own posts and fans. The graph that you can see below analyzes the interaction rate per network. You can thus determine which network works best for you regarding the reached engagement. In the example Instagram receives the highest interaction rate by far.
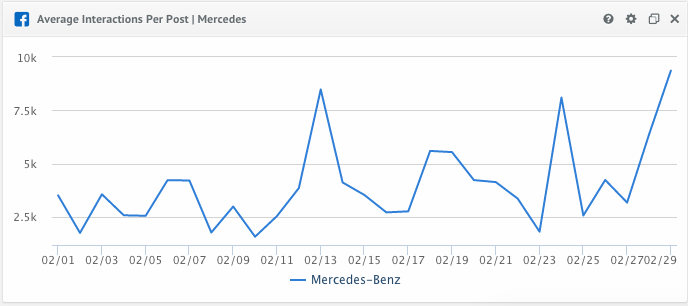
Measure the Average Interactions per Post
With this metric you are able to compare the total amount of interactions (likes + comments + shares) per own post of different profiles. If there are more posts than just one in the chosen period, the amount will be averaged. The Average Interactions per Post can be very useful to determine how a certain post performs by itself. For example, this could be a post introducing a new product. After you published that content, you can then find out how much your audience engaged with it and thus see whether your product hits a nerve. In this graph you can see two distinct peaks which each indicate a large number of interactions on a given post.
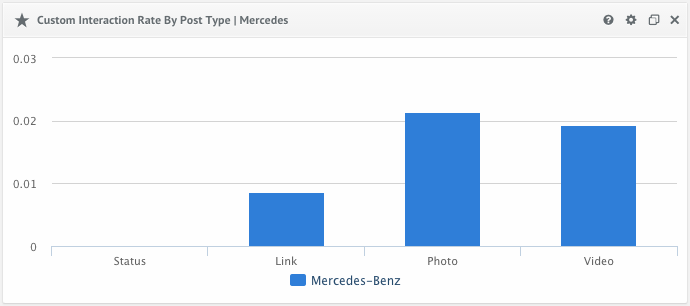
Find the most successful Content Type with the Interaction Rate by Post Type
This metric enables you to analyze the interaction rate bound to a certain post type. It can thus help to determine what kind of content works best and rule out possible misconceptions about what is best to post on your profiles. This information is available for Facebook through its API.
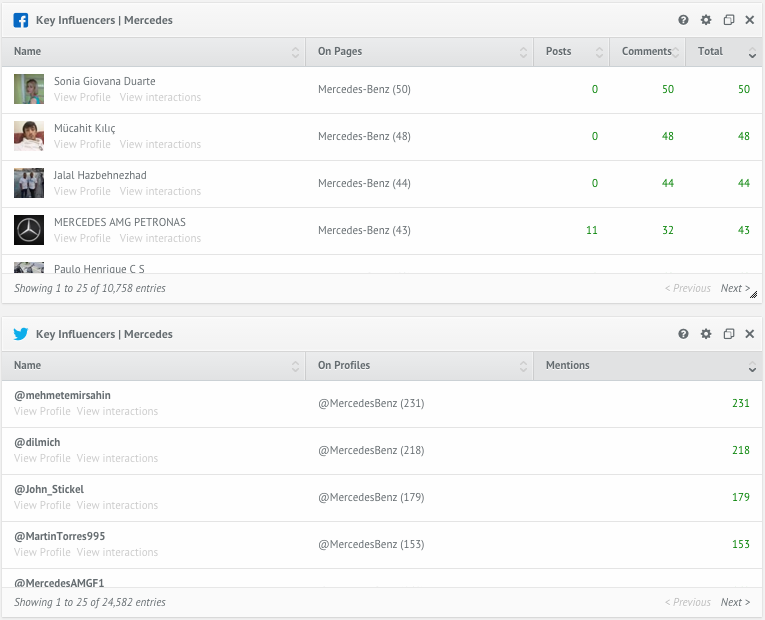
Detect Key Influencers on Facebook and Twitter
With the Key Influencers metric you can easily identify the key interacting users of your profiles. For Facebook, the table chart shows how often those user posted and commented on a page during a selected time range. Using this metric with more than one Facebook page will show possible overlaps. This even may help you to recognize previously unknown competitors of your page on Facebook. In this example, you can see that the top influencer has left 50 comments in February 2016. Identifying your most active users can have several advantages. For example, it can help you prevent damage if this influencer is posting many bad comments on Facebook. But you can also find the users that really like you and bind them even closer to you.
The metric for Twitter is a bit different. The table chart shows how often those user mentioned a profile during a selected time range. Using this metric with more than one Twitter profile will show possible overlaps. This may also help you to recognize previously unknown competitors of your profile on Twitter. Please keep in mind that 'Mentions' include retweets and replies by users. In this example, the user with the most mentions has used the profile handle in 231 times. The benefits you can get from this Twitter metric are very similar to the Facebook metric.
Optimizing your Klipfolio dashboards with quintly data
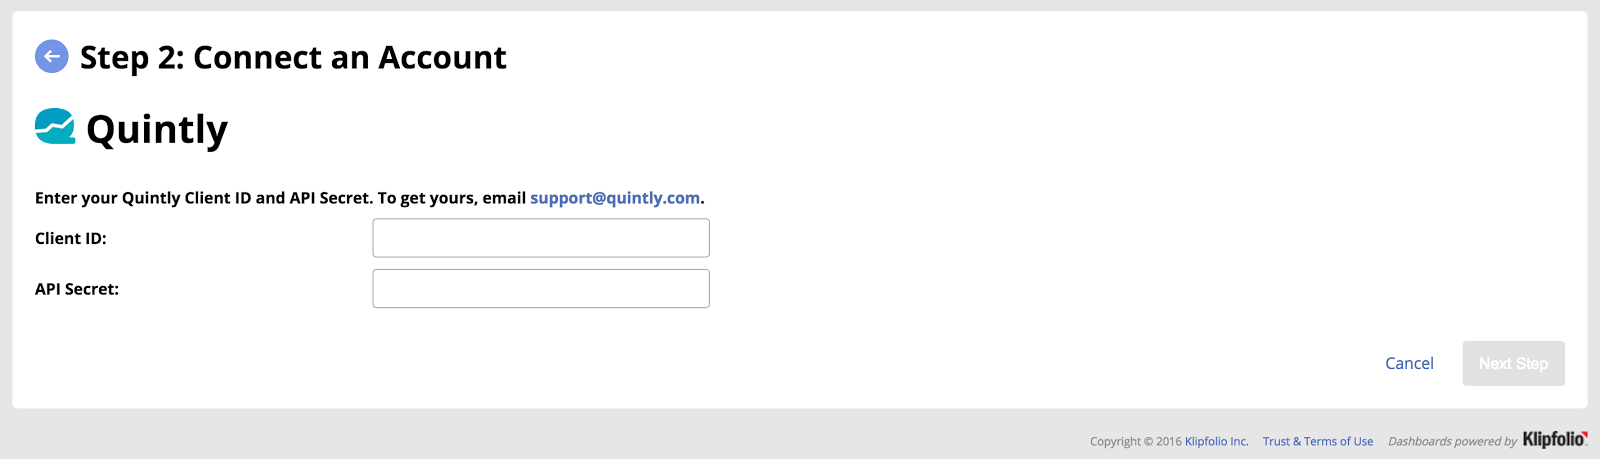
The six presented metrics can help a great deal to understand your social media performance even better. This in return is key for driving successful campaigns. In order to control your set goals, you need to find the correct social media KPIs to measure your goals. Once you've decided which of these six metrics you'd like to monitor, you can add them to Klipfolio to make your Rand Fishkin dashboard even better! There are just some simple steps required.
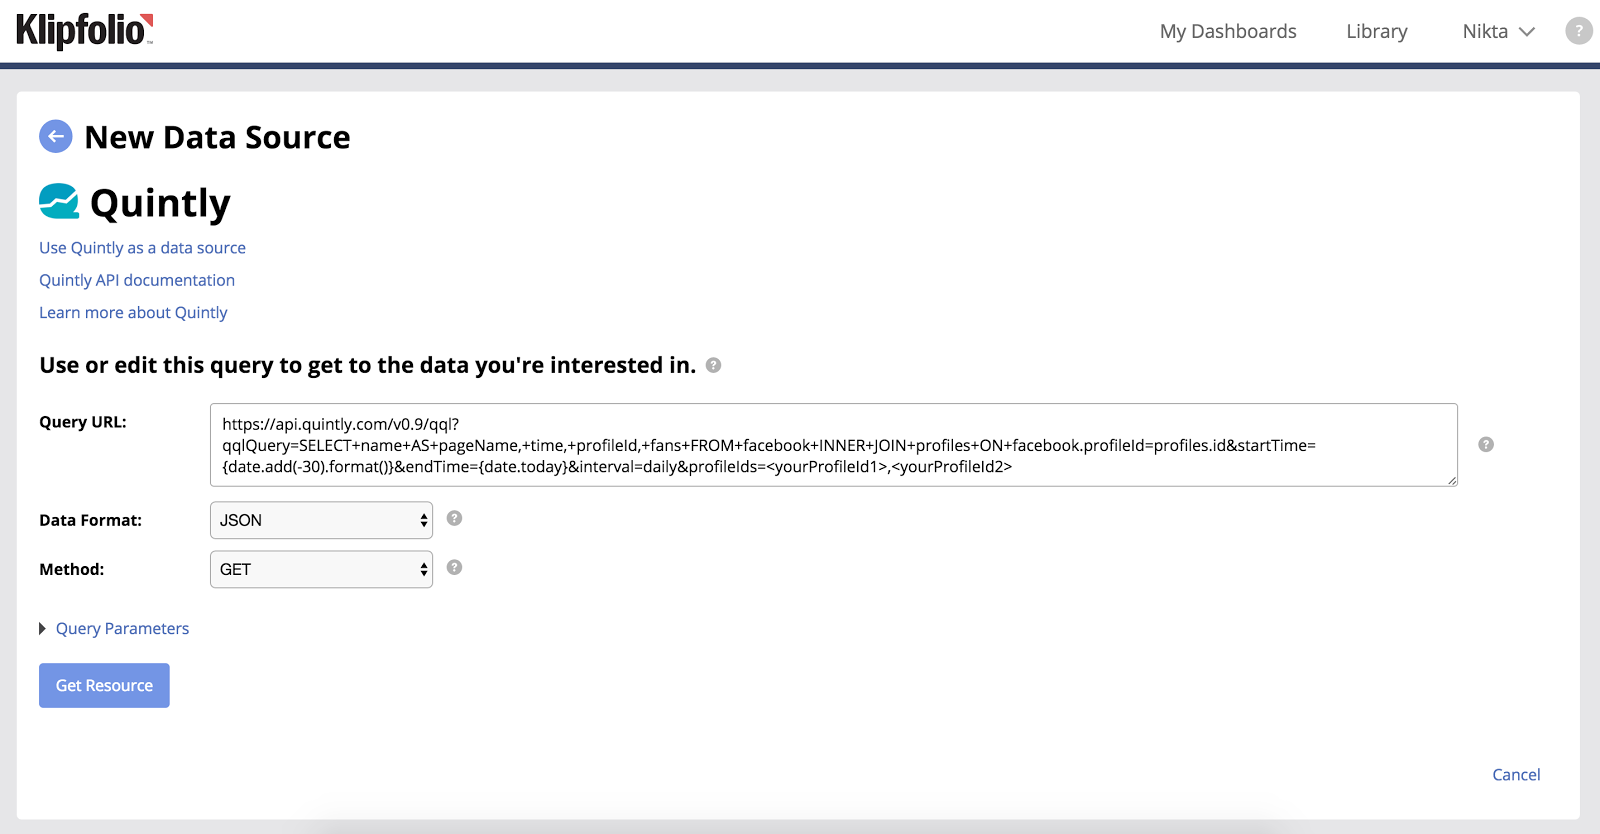
First, you need to connect your quintly account with Klipfolio. Simply login with your ID like shown below. After doing so, you can add quintly metrics by copying the query URL from our tool to Klipfolio.
After these simple step, you have unlocked the full potential that quintly integration to Klipfolio offers. What do you think are the most important metrics for analyzing the awareness that your social media profile gets? Join the discussion either here in the comments, on Facebook or on Twitter.

Join the conversation. Leave us a comment below!