
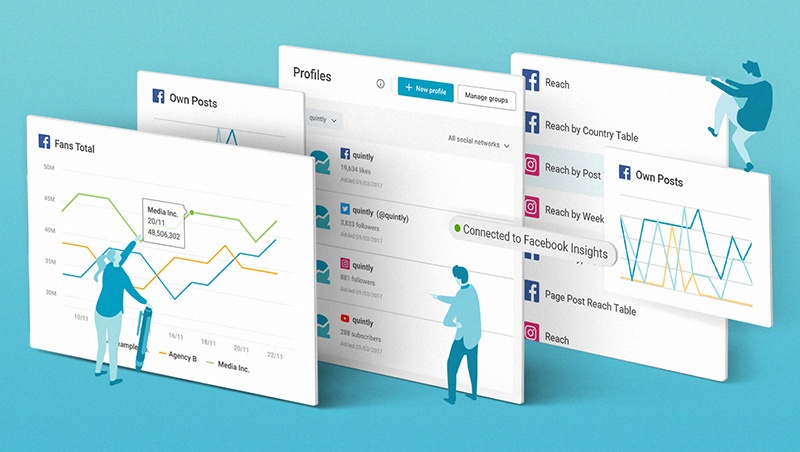
Facebook’s advertising revenue has skyrocketed in the first quarter of 2016. So it is no surprise that many companies, no matter if large or small, are using the services from Facebook to reach a wider audience. The fact that you have landed on this blog post makes it very probable that you yourself are an active Facebook marketer. In the following we want to present you a couple of advanced social media KPIs to monitor your Facebook marketing success and benchmark your performance to other players in your industry.
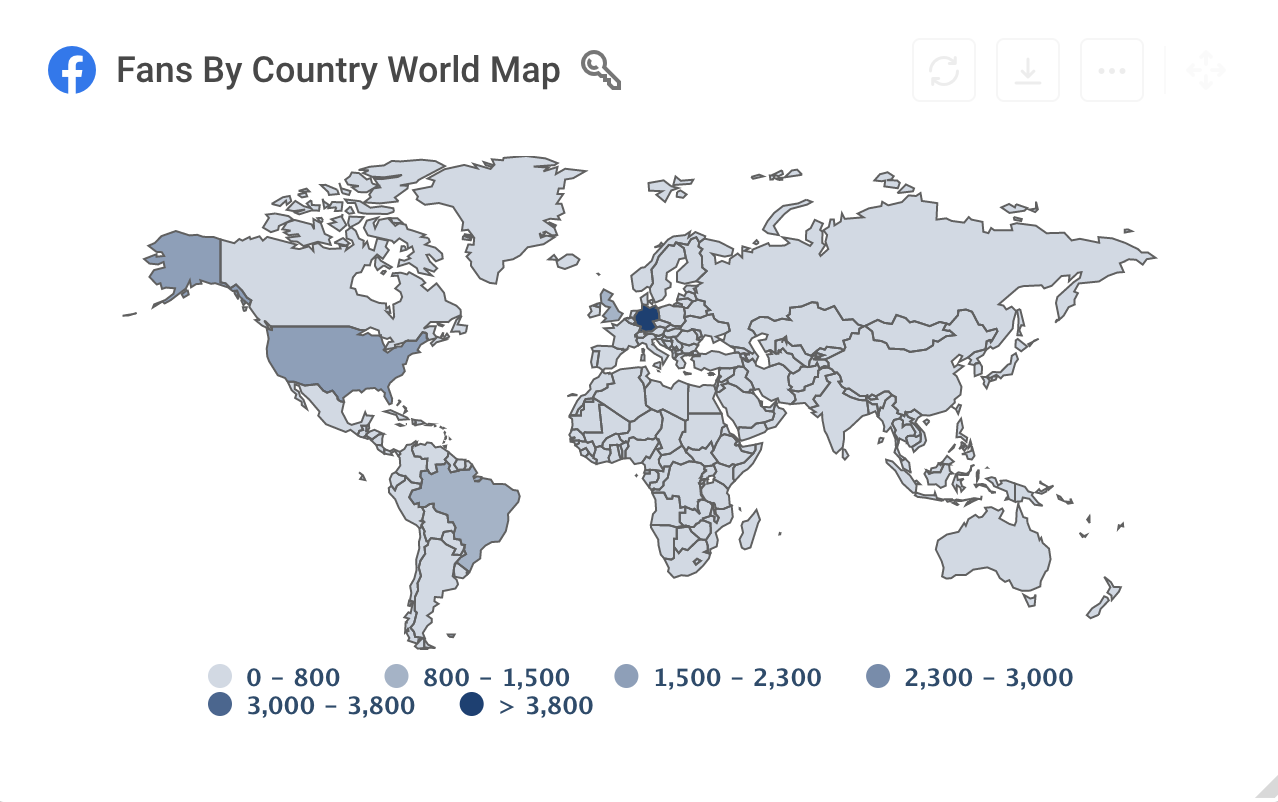
Fans by Country Table / World Map
This metric is very helpful to quickly identify where your fans are coming from. It is not only exciting to see if you have an international crowd viewing and interacting with your content, but it is also vital for your marketing strategy. By identifying where your followers come from, you will be able to allocate your marketing budget better to specific regions and countries or align it with sales activities.
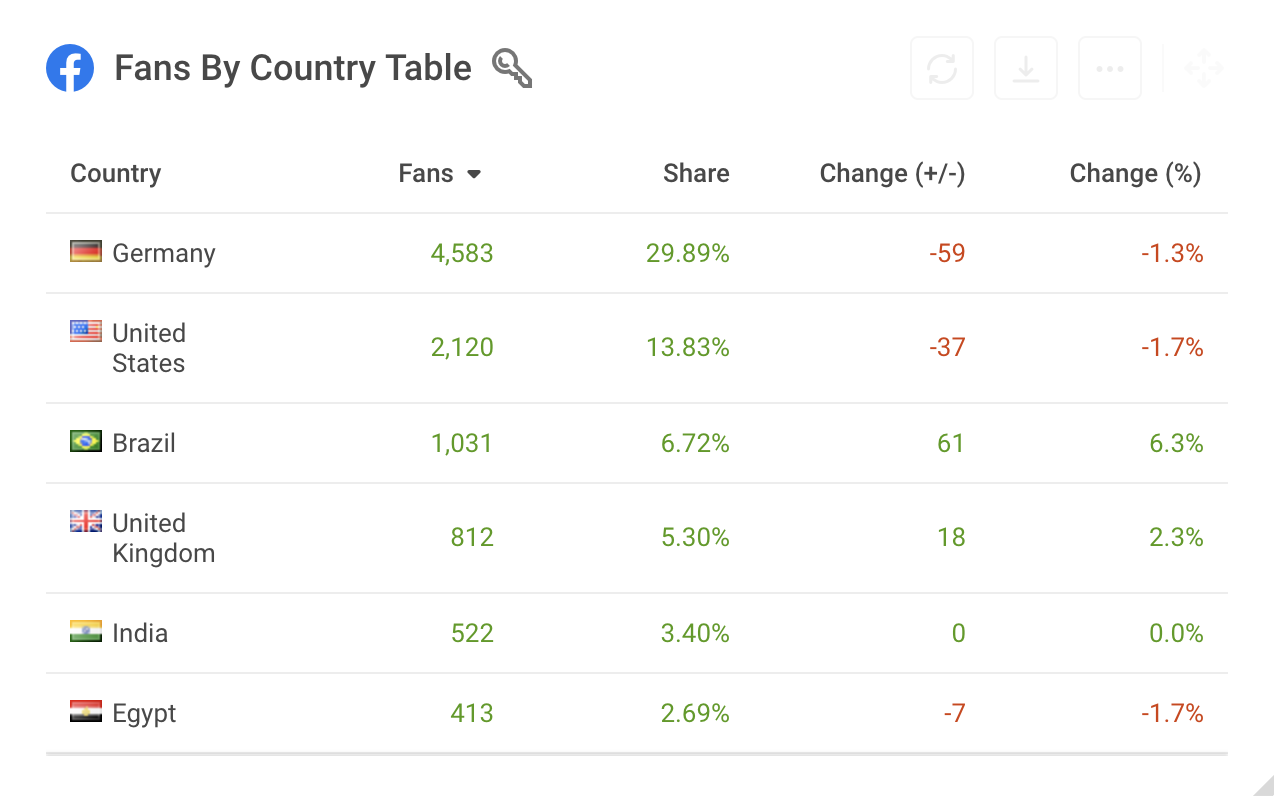
In this article, we want to give you a practical example by looking at our quintly profile. In the table above on the left you can see the countries sorted by the number of fans. It is easy to see that Germany is leading by far. However, its number went slightly down within the observed time frame (June 2018 - July 2019). Accordingly, you cannot only identify which is the leading market but also which is growing the fastest. The map view above will give you another visualization of the data. Within quintly - sign up for a free trial here - you can hover your cursor the countries to discover the relative fan share for each of them.
Posts vs. Total Interactions Metric
When you post content on your brand’s Facebook page, it would be a shame to not follow up on it. It is vital to closely monitor how posts are performing so you can draw important conclusions for optimizing your social media marketing activities. By measuring the total number of interactions (likes, comments and shares) you can see how often people interacted with your content.
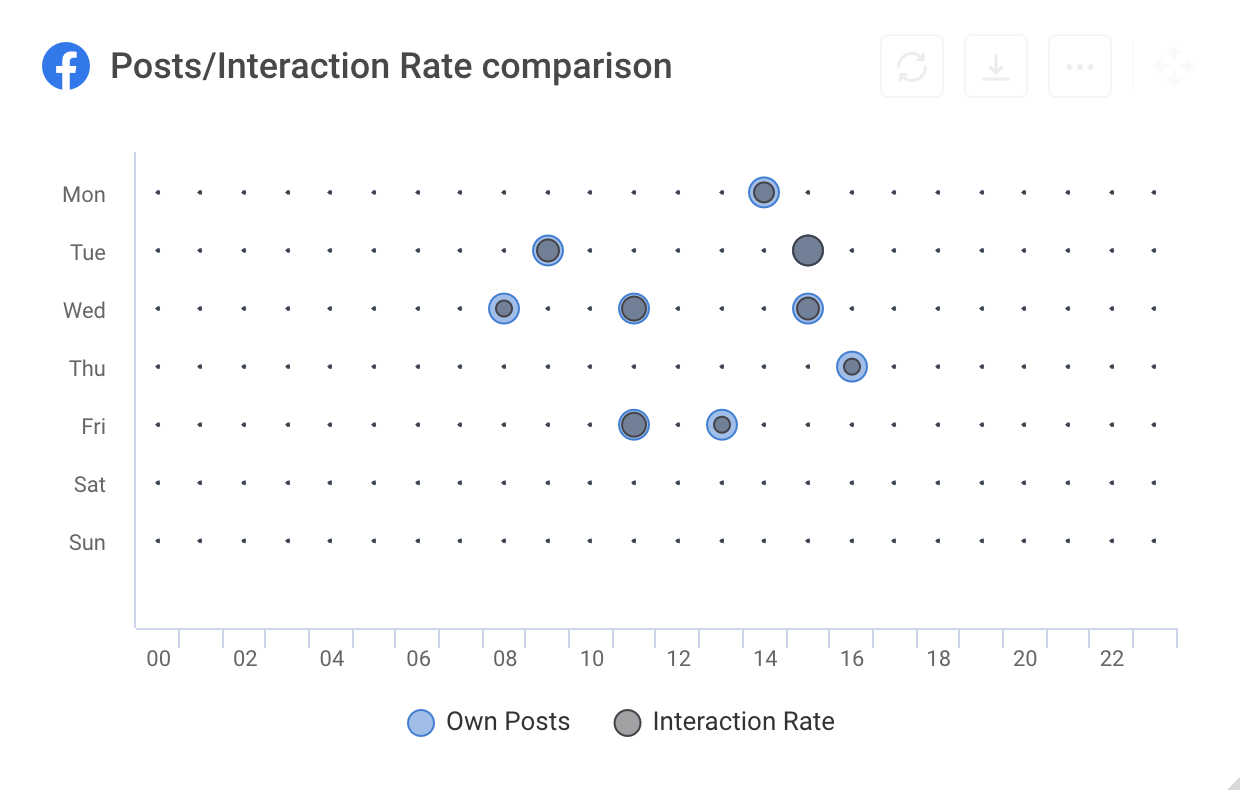
Here you can see a metric that compares the number of posts published and their respective interaction rates by day of the week and time of day. Thus you can easily inspect on which day and at what time a page or a group gets the highest Interaction Rate. This way you can easily see at what time and day of the week how many users interacted with how many own post by these pages by average.
When you analyze our profile f.e., you can see that we could post a bit less on Friday afternoon, as the interaction rate is not that high at this time anyway.
Sponsored Posts on Facebook
You have probably used Facebook ads before and monitored their performance with the statistics they offer. However, you might be wondering how much your competitors rely on paid content. This is why we have launched a state of the art machine learning process that helps detect sponsored content with an accuracy of 96%. Comparing the numbers of sponsored content can be an insightful part within the overall assessment of your social media strategy.
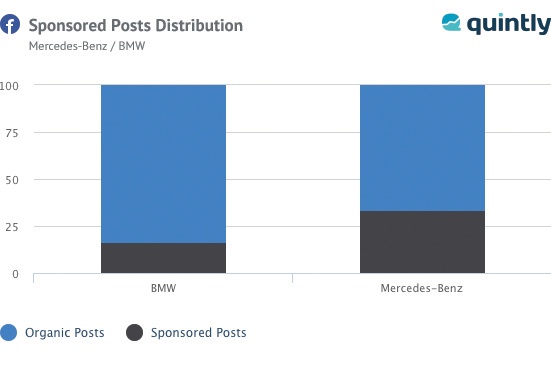
In this special example you can see that while Mercedes-Benz used around 33% of sponsored content in the first week of May in 2016, BMW used approximately 17%. If your competitor is performing better than you, it might be that they are using more paid content. You could thus draw the conclusion that it might be wise to also spend more on advertising.
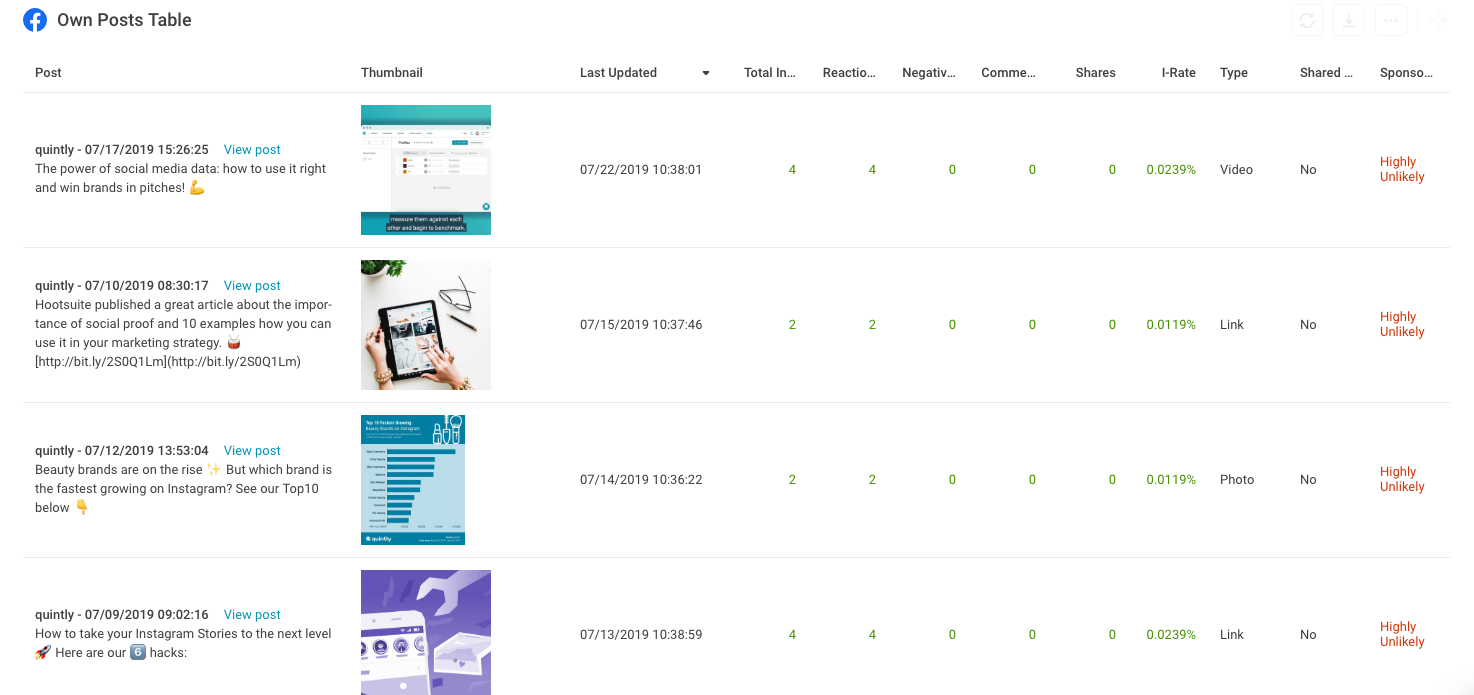
Facebook Insight Metric: Link Clicks
You certainly post links to your company website every now and then and of course you will then want to know how many people clicked on it. This can be found out with Facebook Insights metrics, which are only available for the pages you are managing - you cannot see the numbers of your competitors as this is private data that is not made public by Facebook.
With this comprehensive table, you can sort your posts according to the engagement it received.
Facebook Insights Metric: Users Online
If you post close to the time when your fans are online, chances are highest that they will see your content. With this Facebook Insights metric you will be able to see when your users are online during the course of a day. When looking at data for more than one day, the times will be averaged.
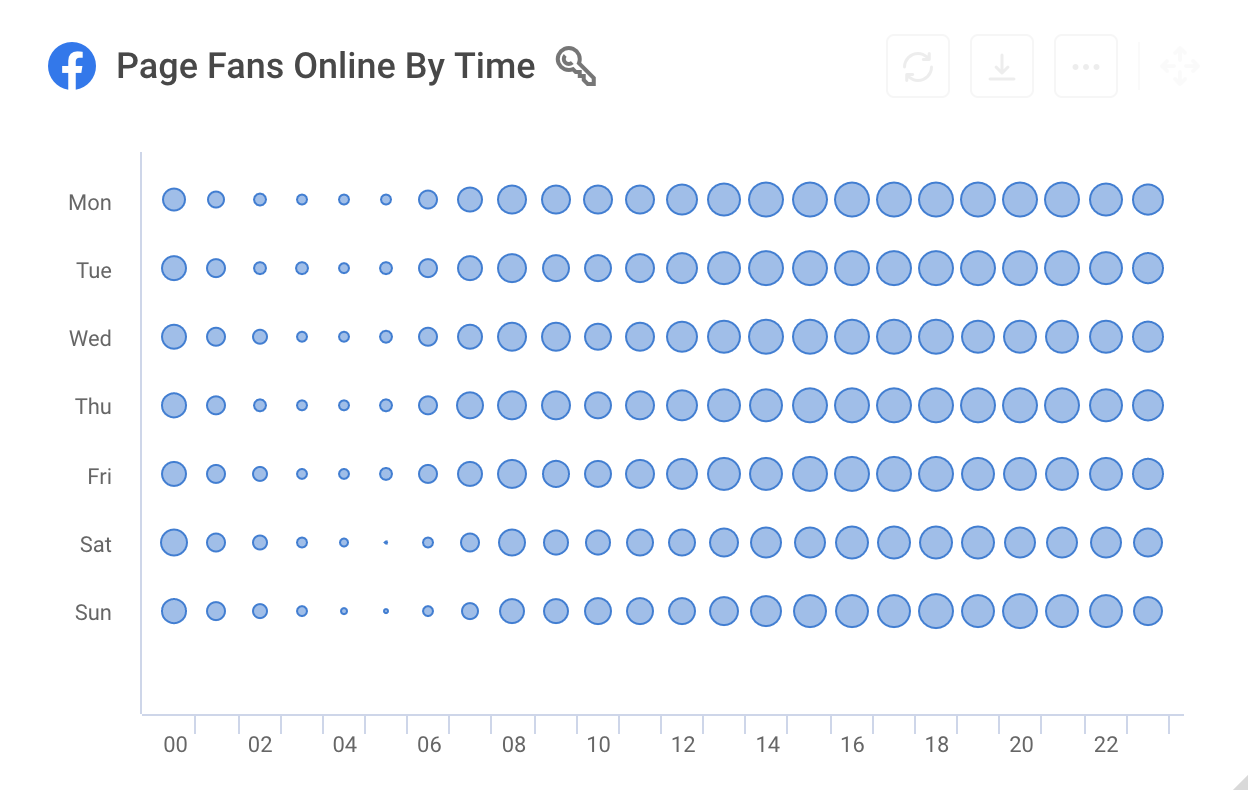
As you can see, most people are online during the second half of the day between 3pm and 9pm.
Measure your success with social media analytics
With a social media analytics tool like quintly you can monitor all social media KPIs and more specifically the Facebook KPIs we have introduced in this post. From the distribution of your fans around the globe to detecting the post with the most link clicks - all these social media stats can help you measure your Facebook performance in order to optimize your marketing strategy. Accordingly, you may be able to spend your financial resources on social media marketing more efficiently.
Do you have any comments or questions? We are just one tweet away! If you want to integrate content marketing KPIs in your strategy, head over to our free social media analytics course in our academy.
Recommended readings
Facebook Trends 2023: The Latest Insights
Short-form Video on Social Media - Technical Infographic
Social Media and Artificial Intelligence: A Match Made in Heaven?

Join the conversation. Leave us a comment below!