

The question how the perfect social media post looks like was already raised on many occasions beforehand. Dozens of social media posts and blog articles already tackled this issue and contributed different results to this widely discussed topic. But the majority of them only provided qualitative evidence for their arguments and left out data-backed results. This’s the reason why we decided to solve the enigmatic question with our astute analysis of 704,040 Facebook posts from January 2018 until the end of April 2018.
Don’t Judge a Post by Its Cover...
I think it’s fair to say that creative aspects, be it the copy of your description or the visualisation of your posts, should always be in the centre of your posting strategy. Now here is the problem with qualitative aspects: they are way harder to measure than objective aspects. Especially for this particular reasons does this analysis take different approach, namely analysing quantitative attributes of a Facebook post. Here is a full overview of our analysis categories:
- Text length
- Content type (text, image, video…)
- Time of post (weekends vs weekdays)
- Used emojis
- Used hashtags
It was important to us to make this analysis as accessible as possible and to do so we decided to the cluster attributes like text length, used emojis and hashtags in different sized buckets. To measure the engagement with the content we picked the average number of interactions as our criteria. Interactions on Facebook include all likes, reactions, comments and shares.
 And the results are…
We’ve covered the formalities of our analysis, let’s now directly jump into the exciting part: the results! All here displayed results are averages of all analysed posts. Meaning, these are averages that represent a broad cross-section of very different social media profiles.
Hypothesis 1: Video posts receive the most interactions.
Nowadays it’s all about visual element, correct? In particular videos on Facebook are a crucial mean to increase the number of interactions, but does this assumption still stand strong when it gets observed? Let’s find out with our first hypothesis: video posts get the most interactions.
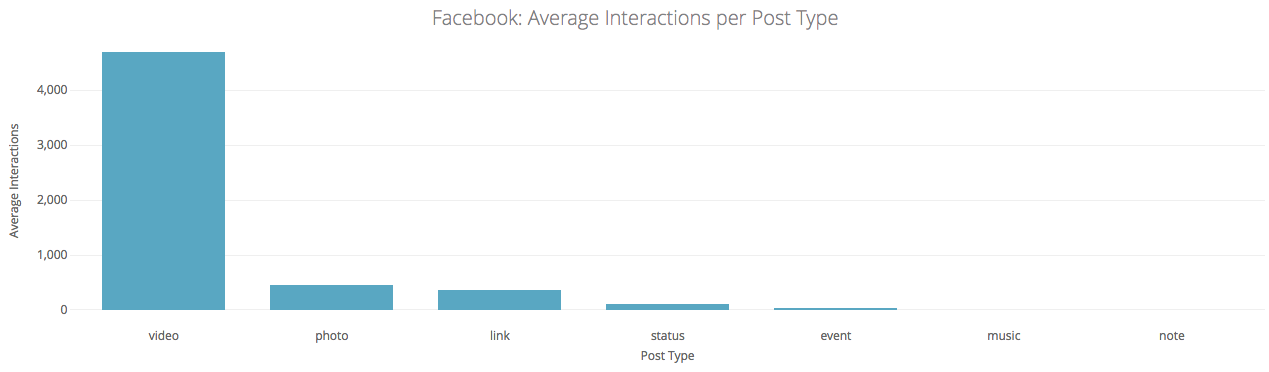
Based on our analysis of 704,040 Facebook posts, we can assure that videos get the most interactions by far, followed by the image post type on the second place. Interesting in this regard: The link post type is the most used post type among the UK Facebook profiles, but comes third in terms of interactions.
Hypothesis 2: Weekday posts are more successful.
Another omnipresent question is handling with the perfect time to post. This is particular interesting when you use a scheduling tool, because you don’t only want to automatise your social media processes, but you also want to have as many interactions possible. Instead of digging into the question of the perfect time to post, we decided to look into the results of weekday and weekend posts. Our second hypothesis: Posts that are published during the week receive more interactions.

The results prove our hypothesis wrong. 78% of the analysed posts were published during the week, but the content that gets more interactions on average is posted on weekends. quintly’s take-away: Be active more on weekends or schedule more posts for Saturday and Sunday.
Hypothesis 3: More text leads to more interactions.
Entertainment and information are two of the main drivers why we click the like button on the Facebook pages of our favourite restaurant, celebrity or sport club. We do this because we want to know what is happening or what the person is up-to at the moment. In some cases you want to know as much as possible about a certain topic and you are not afraid to read long texts by your favourite celebrity. Thus our next hypothesis: more texts lead to more interactions.
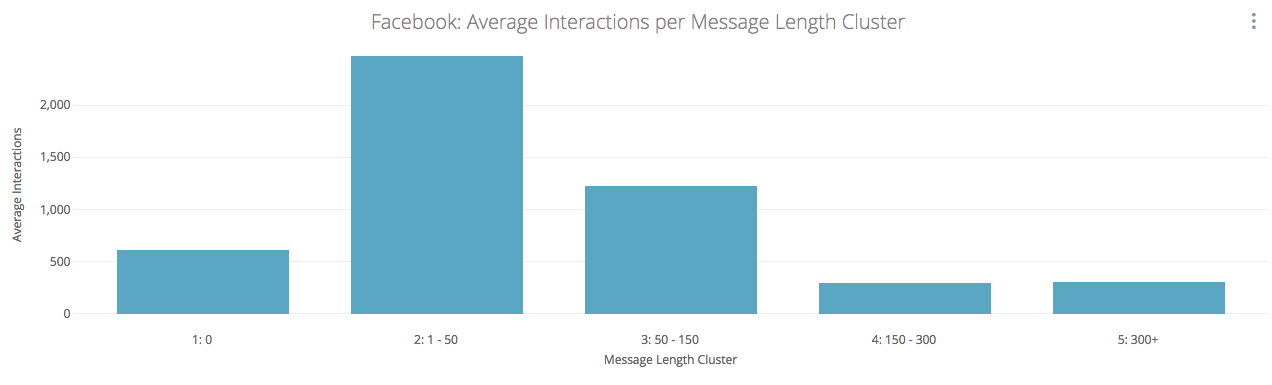
Looking into the results we saw that our hypothesis was proven wrong. Our finding showed us that a Facebook post with 1-50 characters gets the most average interactions. Posts without any text receive the second most interactions. quintly’s next takeaway: Keep your descriptions short and to the point in order to get the attention of your followers.
Hashtags or emojis: Which one do you prefer?
The Facebook relationship status of hashtags and the social network would be: It’s complicated. Hashtags are not as present on Facebook as on other networks like Twitter and Instagram. To directly jump into our result for this category, we can tell you that posts without a hashtag receive the most interactions on average.
But what about emojis? Can the use of emojis boost your interactions? Our analysis as a simple answer to it: Yes. Posts including 1-3 emojis are receiving the most interactions on average. Followed by posts including more than 10 emojis! The motto seems to be: The more the merrier.
Posts without emojis receive the least amount of interactions. Our final takeaway for today: Emojis do not only add a playful element to your Facebook posts, but they also increase your interactions.
Send us a tweet or message us on Facebook, if you have any further questions about our analysis. Also take a look at our “The Perfect Social Media Post” in which we analysed more than 10 million! Facebook and Instagram posts. Subscribe to our newsletter to stay tuned for all upcoming social media analysis.

Join the conversation. Leave us a comment below!