
It is time for our first Twitter study in which we take a closer look on the first six months of 2015 and 2016. We analyzed a huge amount of Twitter profiles, 30k if you want to know the exact number, but don’t expect a simple resume of boring numbers and data. This study provides an interesting in-depth insight into the logic behind Twitter, and works out specific details of usage and strategies of the micro blogging channel. Keep in mind that this study is not only beneficial for marketers but also for everyone else that wants to learn how to measure their own Twitter performance. The numbers will not only help you to understand the changes that happened in comparison to the first half of 2015, but also provide an understanding of the distribution of engagement on Twitter. We categorized the analyzed profiles in six different groups, so that every marketer is able to benchmark their own performance against the individual average. Are you so excited as we are about the results? So let’s get started!
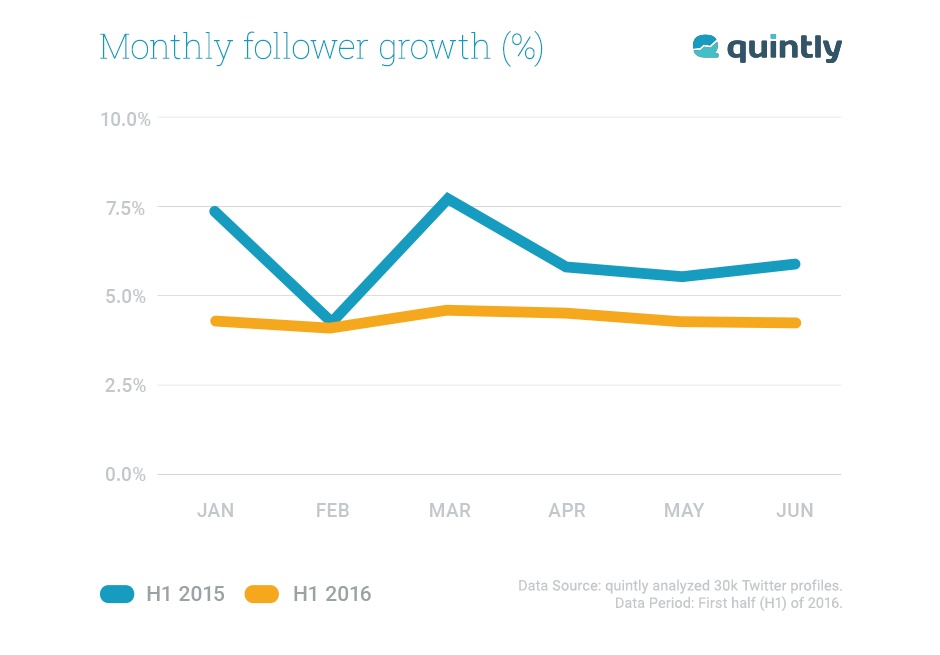
Follower growth falls by 40% compared to the first half of 2015
As part of many marketing strategies, the follower growth is an important indicator for the success of a business on Twitter. More followers enable brands to reach a bigger audience. For this reason the first metric we focus on is the follower growth. Our first finding reveals, that compared to the first half of 2015 the follower growth in the first half of 2016 has declined by 40%. Having said that, the first half of 2016 also shows, that the average follower growth on Twitter remains unchanged, and leveled off to 4%. We indicate from this finding that Twitter gets more saturated and mature as a network.
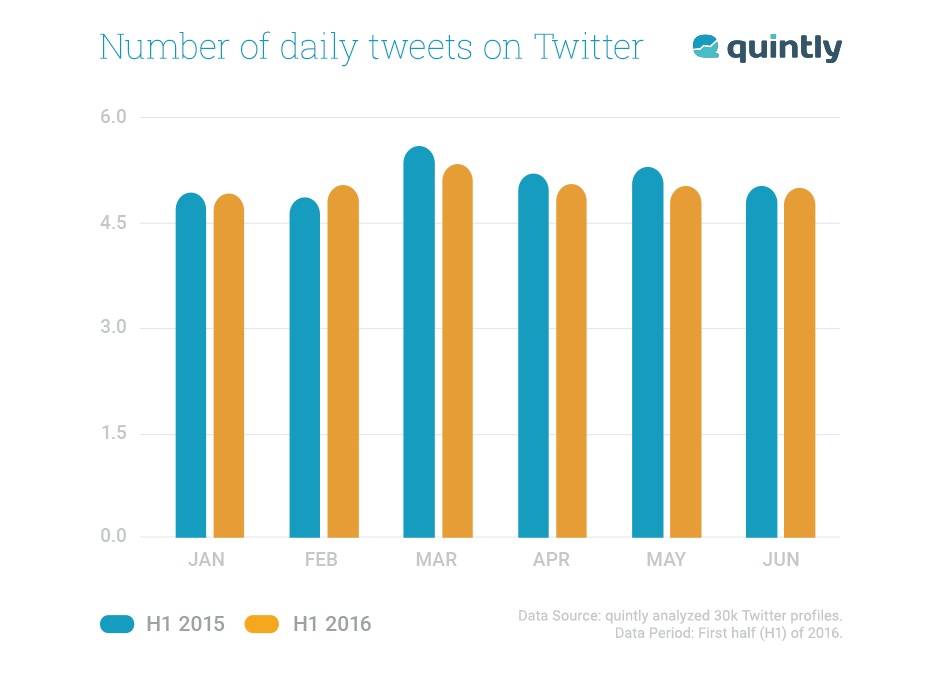
Number of daily tweets remain unchanged
The second metric we take a look at is the number of daily tweets. Twitter is for many businesses a good way to share their content marketing efforts with their followers. By taking a look at the chart you can notice that the number of daily send out tweets in 2016 has been continuing in more or less the same frequency as in the first half of 2015. To sum things up, the tweet frequency slightly varies from month to month, but remain stable between both years.
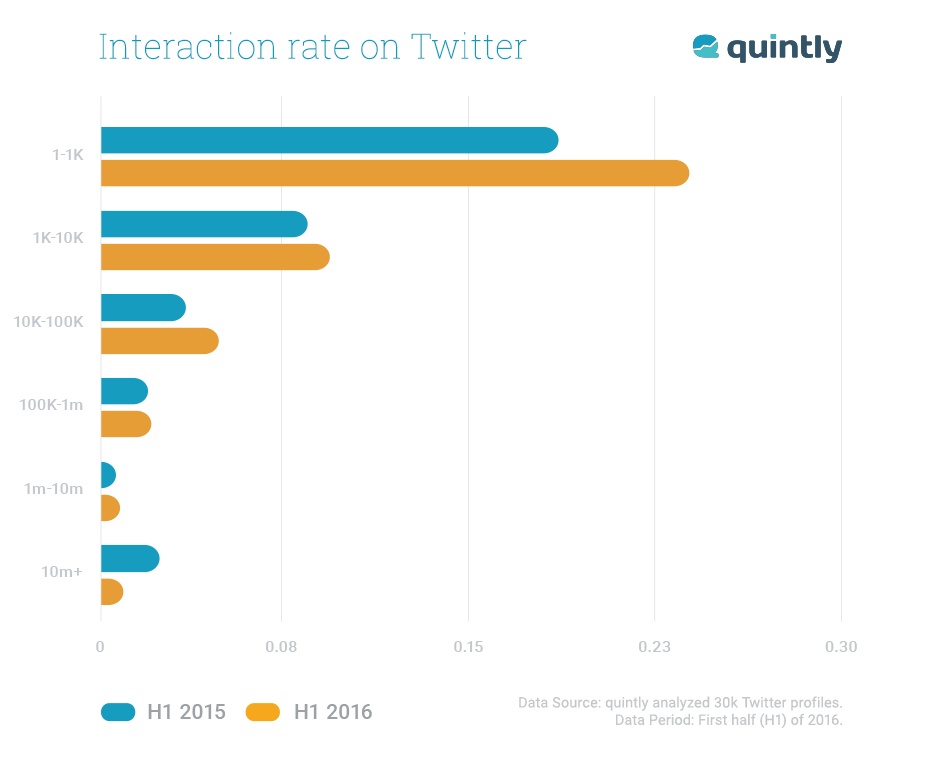
Interaction Rate rises for smaller profiles
Now we want to dig deeper into the interaction rate on Twitter. To understand the following developments, it is crucial to give you further information on what the interaction rate exactly takes into consideration. The interaction rate consists of all interactions (Retweets, Favorites, Replies) divided by posts and followers, that means if the analyzed profiles gain more followers or tweet more frequently, the rates goes down.
The most interesting fact linked to the interaction rate, that compared to 2015, is in the first half of 2016 which shows a rise in interaction rates for almost every profile cluster we have analyzed. Surprisingly, only the profiles that have more than 10 million followers have a decreasing interaction rate compared to the previous year. As seen in the metric below five out of six analyzed profiles clusters of our data set were able to increase their interaction rate between the analyzed years. Thus, Twitter can be a very effective social media network for businesses of all sizes. In comparison, the interactions of the biggest profile clusters, which mostly are celebrities, went down by more than 50%.
In the next part we take a closer look at the average interactions per tweet. For your information: The interactions is concentrating on the number of total interactions.
Interactions for biggest profiles decreased by 58%
The total interactions of the most famous Twitter personalities are massively declined by 58% although the number of daily tweets has been almost unchanged during H1 2015 and 2016. Interactions for smaller profiles remained unchanged whereas the biggest profiles show drastic changes. In particular, we discovered that larger Twitter profiles are heavily losing audience attention. If profiles from 10-100k followers are able to increase their interactions, that is a good indicator that those profiles tend to benefit from Twitter.
For further information and outcomes of our semi annual study, access the whole study above for free.
If you want to find out if your interactions have decreased in the analyzed period, or remained stable you can check this with our free trial.
We hope that our study gave you interesting insights into the development of Twitter. To recapitulate our findings it is to say that the biggest Twitter profiles are getting significantly less interactions in the first half of 2016, compared to the year before. A reason for this could be the increasingly fast timelines, which may lead to an overload of information. In contrast, smaller profiles are receiving higher amount of interactions (seen in the interaction rate above, too), which indicates that the medium is still a great opportunity for small and medium sized businesses.
Let us know if you have any further questions regarding our study - We are as always just one tweet away!

Join the conversation. Leave us a comment below!