
The following study analyzes 100,000 Facebook profiles and more than 80 million posts from June 2014 to June 2015. The results give insights into which Facebook post type is used most predominantly when marketers share their work and receives highest engagement on Facebook in the end. Increasingly many businesses are relying heavily on content marketing as part of their marketing activities to receive highest engagement possible. Therefore companies try to reach as many users of their target groups as possible.
Main Findings
Links and images posted most frequently, videos and images drive highest engagement, photo post interactions increasing, interactions on link posts low but increasing.
Facebook, remaining the ‘top dog’ in social media, plays an essential role when sharing content. Considering that one of the ultimate goals in social media is to engage people, the study conducted will help marketers to understand the development of engagement in the past and identify trends for the future. This knowledge will help to improve own posting patterns immediately and drive higher engagement on Facebook marketing. Through this knowledge marketers are able to identify the most engaging post types on Facebook.

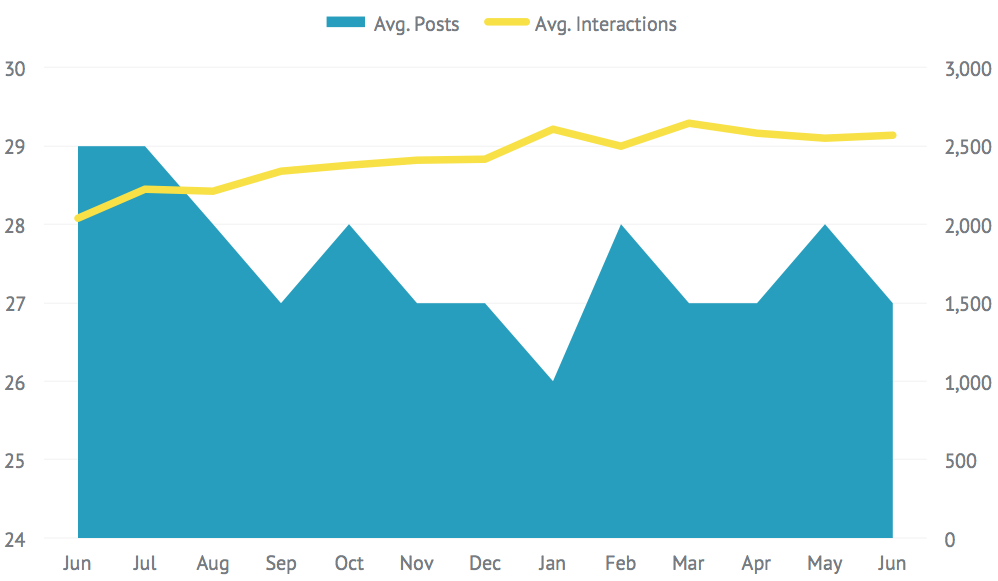
Due to the strong rise of video posts during the last year, interactions per post went down during the analyzed period - vice versa for photo posts. Here the post frequency for the average Facebook Page decreased from 29 to 27 per month but the average interactions increased from 2,000 to 2,500+ for each post.
As interactions are constantly on a rise, it can be seen that reached users have an intention to interact. Analyzing Facebook Analytics here, many marketers face the problem of decreasing organic reach as a result of the timeline algorithm used by Facebook. Continuously spending small amounts of money on promoting posts will help to reach the fanbase and increase engagement on Facebook. With a budget of only 10 US Dollars per week you can already bolster social media activities significantly. Together with knowing some essential stats revealed in our social media study you can receive highest engagement possible.

In addition to that, the analyzed data shows an increase from 23 to 35 per month for the average page in posts containing only links, even though the interactions are comparatively low here. These trends in the social sphere should be monitored by marketers who can use it to boost their own performance easily.
In a nutshell it can be said that photos are getting increasingly important in social media marketing. As discussed on many blogs, the majority of people are visual learners, thus visuals are faster processed in the brain. With that in mind, businesses should choose pictures for their posts wisely, add a link to the image post and consider not posting links alone.
Are you using stats before choosing your content type? Check details, and share
Any questions regarding the study? We are just one tweet away!

Join the conversation. Leave us a comment below!