
It’s Super Bowl time again! This year the Denver Broncos and Carolina Panthers will compete against each other. The Panthers lost only one game in NFC South and Bronco’s defense outperformed nearly everybody else in the season. Without a doubt, the game is going to be exciting. But besides the actual match in Santa Clara, there is another fight between the two teams raging on three other battlegrounds: Facebook, Twitter and Instagram. So today, we want to take a closer look at the numbers and stats in the social networks.
Let’s start with some overall metrics to understand the big picture of the social media profiles performance.
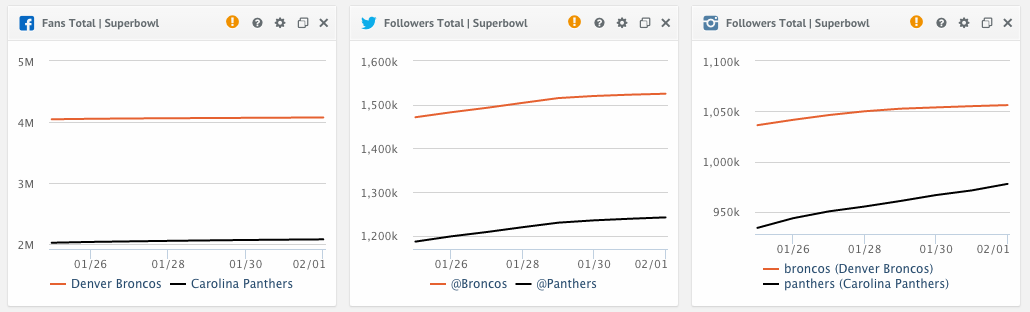
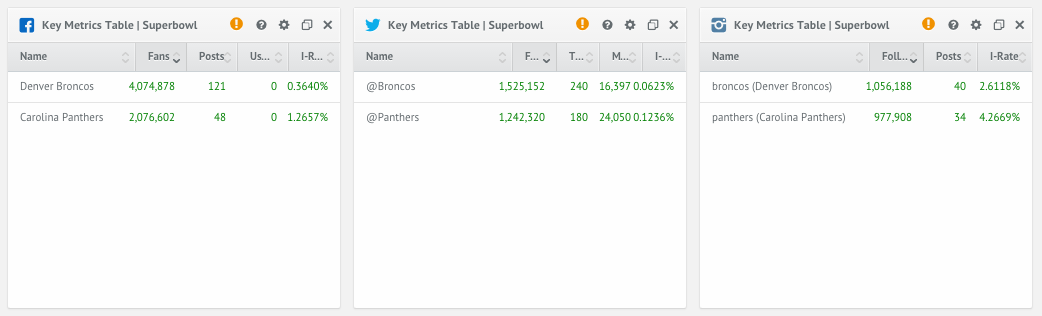
First Down - Overall Social Media Metrics
To get an understanding of the situation in social media, we had a look at our most basic metric and identified Broncos with significantly more fans in every network analyzed, whereas Panthers winning more fans.
Second Down - Interaction Distribution
To receive a deeper insight on how fans and followers react on the posted content we checked on how interactions are distributed. This metric helps to understand how “shareable” content posted is perceived.
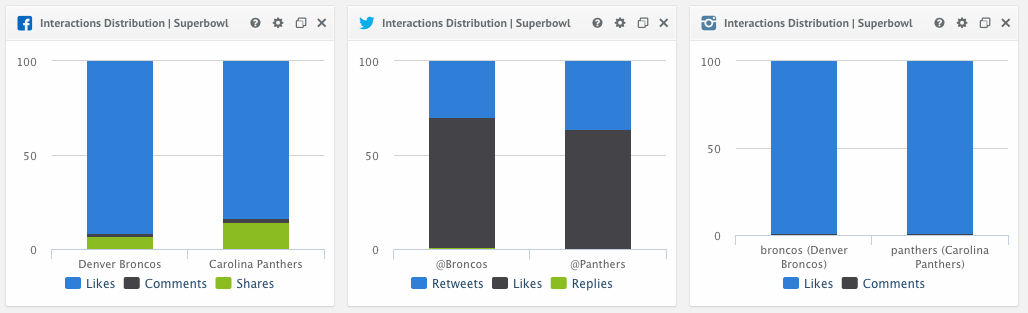
On Facebook, the Panthers receive a slightly higher amount of shares than the Broncos. On Twitter, the share of re-tweets is slightly higher as well. On Instagram, as the last network analyzed, both teams receive 98% likes and around 2% of comments. To keep things short, the Panthers seem to do a slightly better job on Facebook identified by more shares on their posts.
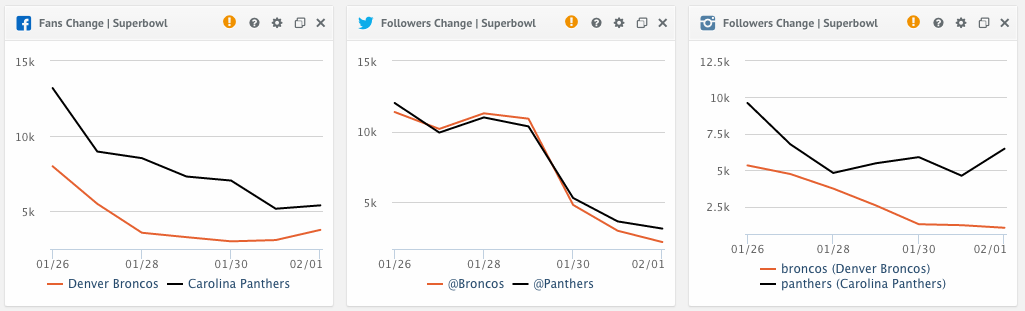
Third Down - Fan Change
As seen before, the Broncos seem to be better recognized in social media than their rival from Carolina. Nevertheless, Carolina as the team with most victories in pre-season, has a highly positive fan and follower change in the three networks analyzed.
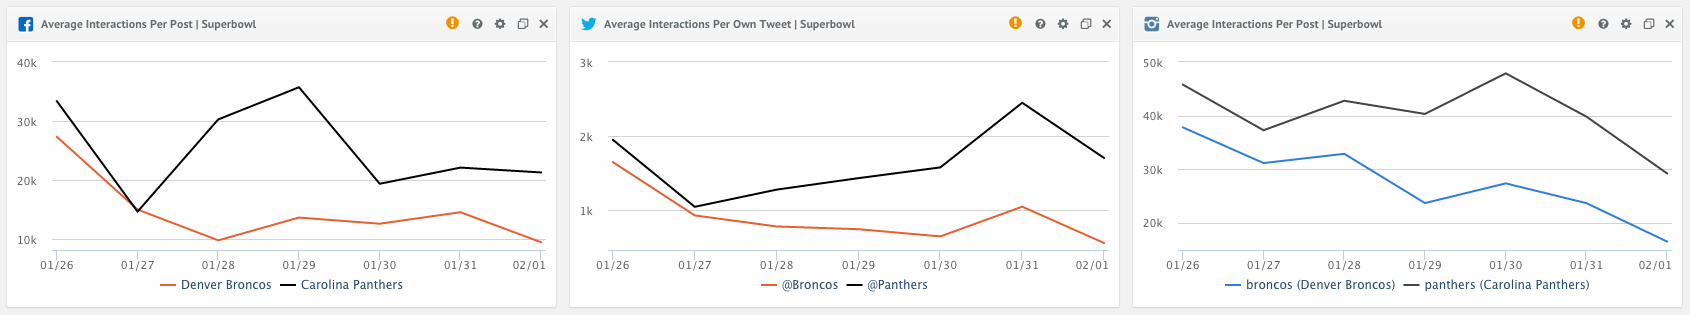
Fourth Down - Interactions
So, let’s have a look at the interactions of both teams. Here we chose the metric average interaction per post and tweet. Total interactions for each network are displayed and thus easy to compare. On Facebook and Twitter the Carolina Panthers receive almost the double amount of interactions per post. Whereas Denver receives an average of 13k interactions (likes, comments and shares on Facebook) their competitors from the East Coast manage to receive over 35k at peak times and around 25k on average. On Twitter these stats are similar. On Instagram, Panthers are winning the social media duel, too, as they constantly 10k interactions more than Denver.


Join the conversation. Leave us a comment below!