

The best time to post on Instagram is different for every company, product, and account. No company is the same and neither are their audiences, therefore their posting behavior is unique too. The time when the posts on your Instagram receive the most interactions is dependent on your audience and the time zone they’re active in.
This might be a struggle for companies who are internationally active; your audience in the United States might still be asleep while your European followers are already on their lunch break.
Multiple kinds of research has been done already to figure out the best times to post on all social media platforms, but most of this research is bound to a specific time zone, meaning it’ll likely not be applicable to all companies’ Instagram strategies. Or the researchers come up with a new rule of thumb, which will probably not work for your audience as, once again, every audience is unique.
Assuming that people bring their phones wherever they go, they’ll be able to check their Instagram feeds whenever they want, increasing the chances of them seeing your content.
Trying to get engagement in one time zone
When you’re selling to people in your own time zone only, it’s, of course, a lot easier to figure out what post-time works best for your audience.
Half of all Instagram users make daily use of the app, and most of them access the content more during off-work hours than during the office hours. So, free time is the time that your audience is most likely to see your content.
We’ve created a short list of the times that get the most engagement from audiences.
During their daily commutes to work (8 - 9 a.m.) This is the most common time I found in the researches done. It makes sense because when people are on the morning train most of them like to keep to themselves. So, the logical thing to do is to take out their phone and start scrolling through Instagram.
During their daily commute back home (5 - 6 p.m.) Just like the commute to work, people often want to keep to themselves after a day at work. Opening their Instagram app helps them switch off from all the stress at work.
During (lunch) breaks (12 - 2 p.m.). This is also a popular time when people take out their phones and start scrolling through social media.
In the early mornings and evenings. Our phones are often the first thing we look at in the morning and the last thing we look at before going to sleep. That makes early mornings and evenings good times to post on your Instagram page as many people might see your content.
To test this theory for your own brand, you could try posting at different times for a few weeks and see which of these times receive the most engagement. You could, of course, manually scroll through your posts and compare the number of likes and comments between the different post times, but this could take up a lot of your time and will most likely not provide you with a clear overview.
Using a social media analytics tool like quintly, you can easily track this data and see exactly when your posts received the most interactions.
Instagram Insights
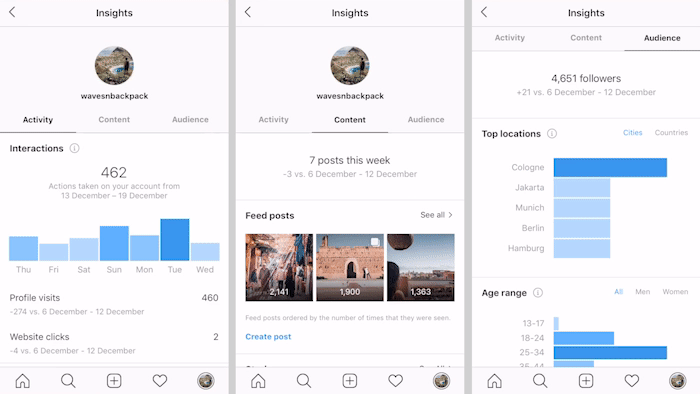
Instagram also provides you with personal insights for your account. Next to some basic information about your audience’s age group, gender and location, you can also find out what days your followers are most active!
You can easily access this data through your account page by tapping the bar graph icon in the upper right corner. On the right press "audience" to open the page with graphs about followers, their gender, age range, top locations and online times.
All the way down, on the bottom of the page, you’ll find the graphs about your followers’ activity. By tapping “hours”, you’ll see for every day at what times most of your followers are scrolling through the app.
You can also tap “days”, which will then show you on what days your followers are most active on Instagram.
This data only shows when most of your followers are online, which would logically mean that you’d receive the highest engagement from that. But that’s not necessarily true.
What is the best day to post on Instagram?
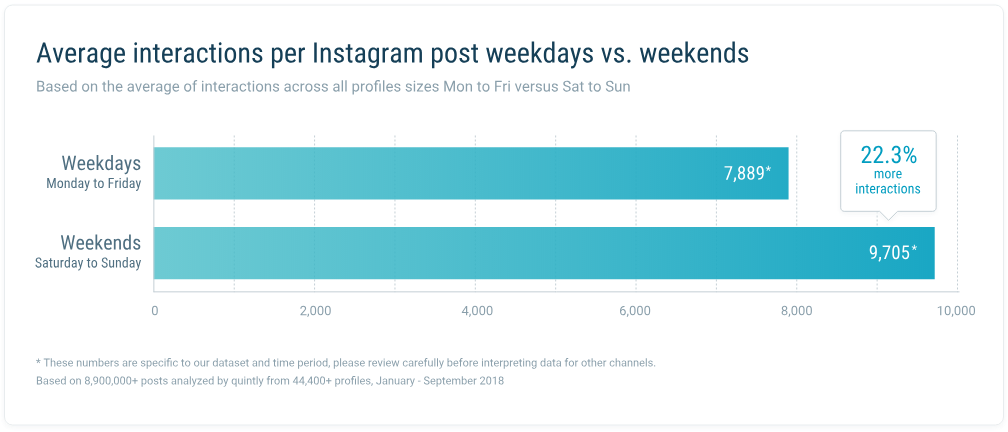
It might also be interesting to look at the difference between weekends and weekdays.
A previous quintly study showed that content posted on the weekends receive 22.3% more interactions than posts on weekdays.
It’s, of course, a logical result, seeing as most people are off work during the weekends and, therefore, get to spend more time on social media.
Think of what days your customers might be online the most. Probably the days when they have more free time, which is during the weekends.
Using an Analytics tool to measure engagement
Of course, the information mentioned above is true to a certain extent and will probably help your company increase engagement on Instagram posts. But they will only work for the same time zone and will never be 100% accurate for every brand.
That’s where a social media analytics tool like quintly can help you out. Next to being a useful tool for companies who are active in their own time zone, quintly can also help create a clear overview of the best times to post for international companies.
A good tool for finding out the best time to post for your brand is the Post/Interactions Comparison metric. Don’t get carried away with assumptions but base your posting times on relevant data.
For this metric, I looked at the globally active Airbnb (10/11/18 - 10/12/18). The times and days shown in this metric are based on local time (Germany CET).
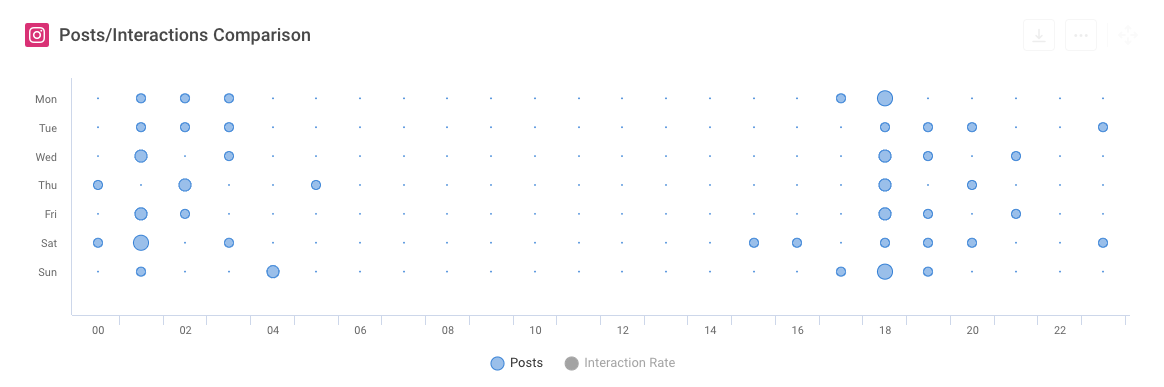
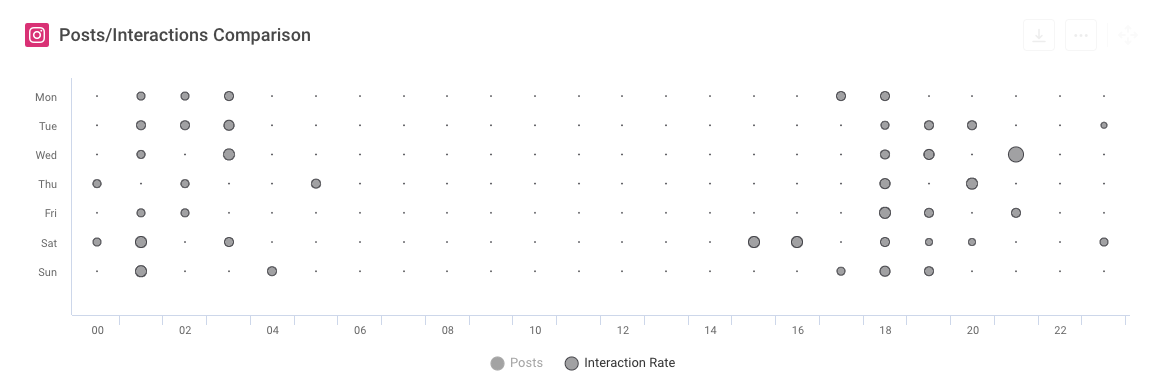
This first image shows when Airbnb posted on their Instagram. Each blue bubble shows when at least one post was created. The bigger the bubble, the more posts that were put onto Airbnb’s Instagram. In the second image, the grey bubbles show when Airbnb received interactions on their posts. The bigger the bubble, the higher the interactions.
Looking at the first image, it shows that Airbnb posts at 6 p.m. every day of the week, which is also when they receive a good amount of interactions. Comparing the blue and gray bubbles, you can see that they’re roughly the same size, which means that Airbnb has picked the right times to post on their Instagram.
Focusing on Wednesday at 21:00, you can see that the bubble for the interactions is a lot bigger than the bubble for the posts. This is a time when Airbnb could post more than they did because they receive the highest interactions at this time
By making smart use of this information, Airbnb could optimize their posting times according to when the engagement from their audience is the highest.
Conclusion
Figuring out what the best time to post is can be very time consuming if you’re trying to do it by means of trial and error. It also doesn’t necessarily provide you with the necessary information about your audience.
By using an analytics tool like quintly, you will receive relevant data about your online behavior, and that of your audience, directly taken from your account. This will help you with finding the best time to post in order to increase the interactions you receive on your posts.
Being more data-driven in your social media behavior will help you optimize the potential of your accounts.
Recommended Readings
The Ultimate Social Media Analytics Guide
Instagram Study: We analyzed 9 million posts
10 Tips and Tricks for Better Interaction on Instagram
Instagram Stories for Businesses: The Leader in Short-Form Video

Join the conversation. Leave us a comment below!