

Instagram has over 1 billion users worldwide. This is not only a huge amount of registered users but also a lot of many different use cases. Some use it to share their life with their friends, influencers make a living out of the platform and brands engage with their audience or to generate new customers.
All these different use cases made us curious. For this reason, we decided to learn more about the usage of the social network by analyzing the performance of 44,432 Instagram Business profiles and over 8.9 million posts between January 1 and September 30, 2018.
Now it’s time to put your reading glasses on and to get excited about our findings!
Key focus of our Instagram study
We clustered our dataset in six differently-sized groups, to make it applicable for your specific Instagram account:

And here is an overview of the six categories we analyzed:
- Follower development
- Post type performance
- The length of posts
- Usage of hashtags
- Emojis on Instagram
- Posting time
Let’s dive into the data.
Instagram profiles grew up to 33%
This year was a strong year for Instagram. Not only for the network itself, but also for the users, influencers and brands using it. You ask why? By observing the fan growth in the differently-sized buckets, we detected an overall growth for all analyzed profiles.
Breaking the number down to our different profile groups, it can be seen that the profile growth spans from 17% up to 33%.

Videos get up to 21% more interactions
Images are the most common post type, but how do they compare in terms of interactions (Note: Interactions are defined as the sum of likes + comments) to carousels and videos? The answer is that they perform on average not as well as the other two formats.
Taking a look at the performance of each format is revealing:

Do you want to know which post type was used the most? Find it out in our study.
31% have lengthy post descriptions
Instagram is all about browsing, getting visual inspiration and quick entertainment, it seems. So it comes as a surprise that 31% of overall Instagram posts have more than 300 characters in their post description.
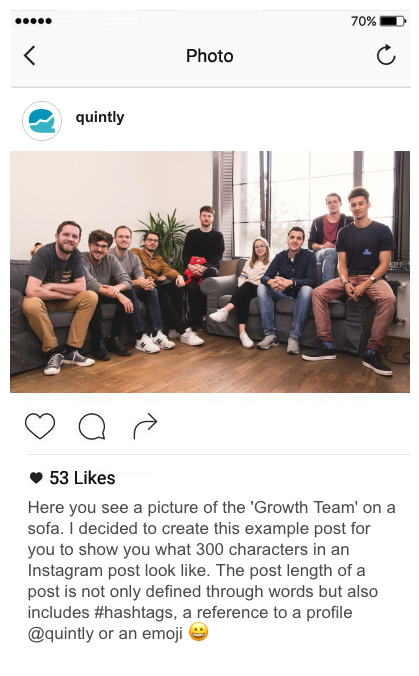
On the one hand, we have a prevalence of posts with over 300 characters, but on the other hand, we see that only 1% of posts use no description at all.

Posting without providing a further context doesn’t seem to be the standard. Drilling down these findings, we wanted to see how writing maniacs the different profile groups really are.
Find the ideal perfect length specifically for your profile size in our study.
1-3 #Hashtags used the most
Hashtags on Instagram are a vital way to easily find your posts. Adding hashtags to a post is a great way to make your content more visible and potentially reach more people that might be interested in your content. But how many hashtags should you use in your post? Let’s take a look at the usage of hashtags and the data-driven answer to the question:

55% of profiles don’t use emojis
Thinking face 🤔, face with tears of joy 😂 or the red heart ❤️ - all of these emojis are used in nearly everyone's day-to-day communication. But are emojis simply are a nice way of making your post a bit more personal or are they actually stirring your interactions?
Our dataset revealed that 54.9% of profiles don’t use emojis at all. But does this lead to more or less interactions? Find it out in our study.

Weekend or Weekdays? When do posts tend to receive higher interactions? Access the the answer to this question in our Instagram study.
Go and try it out
I hope you enjoyed our study, and it would be even better if you could pull out helpful insights for yourself.
Please keep in mind that the results of our study are averages of our specific data set (even if it consisted of almost 9 million posts) and adapting our findings will not directly positively influence the performance of your profile. Take them as inspiration for your own Instagram strategy. Never forget! Every Instagram profile works in its own way and, therefore, it’s necessary to keep a close eye on your performance.
Do you have any best practices to share with us? Leave us a comment and tell us how you utilize the platform for your own benefit. Looking forward to hearing from you.
Recommended reading:
Emojis Lead up to 47.7% More Interactions on InstagramInstagram Stories – From A to Z
A Complete Guide to Influencer Marketing
Instagram Ad Analytics

Join the conversation. Leave us a comment below!