
Summary: quintly introduces the new Analysis section to allow faster and easier access to specific performance data. It helps to draw quicker conclusions for optimizing your social media strategy.
Up until now, dashboards have been the main section in quintly to measure your social marketing performance and validate its impact to draw data-backed conclusions. They usually contain various KPIs for an individual use case specific to quintly users and often lay the ground for reports.
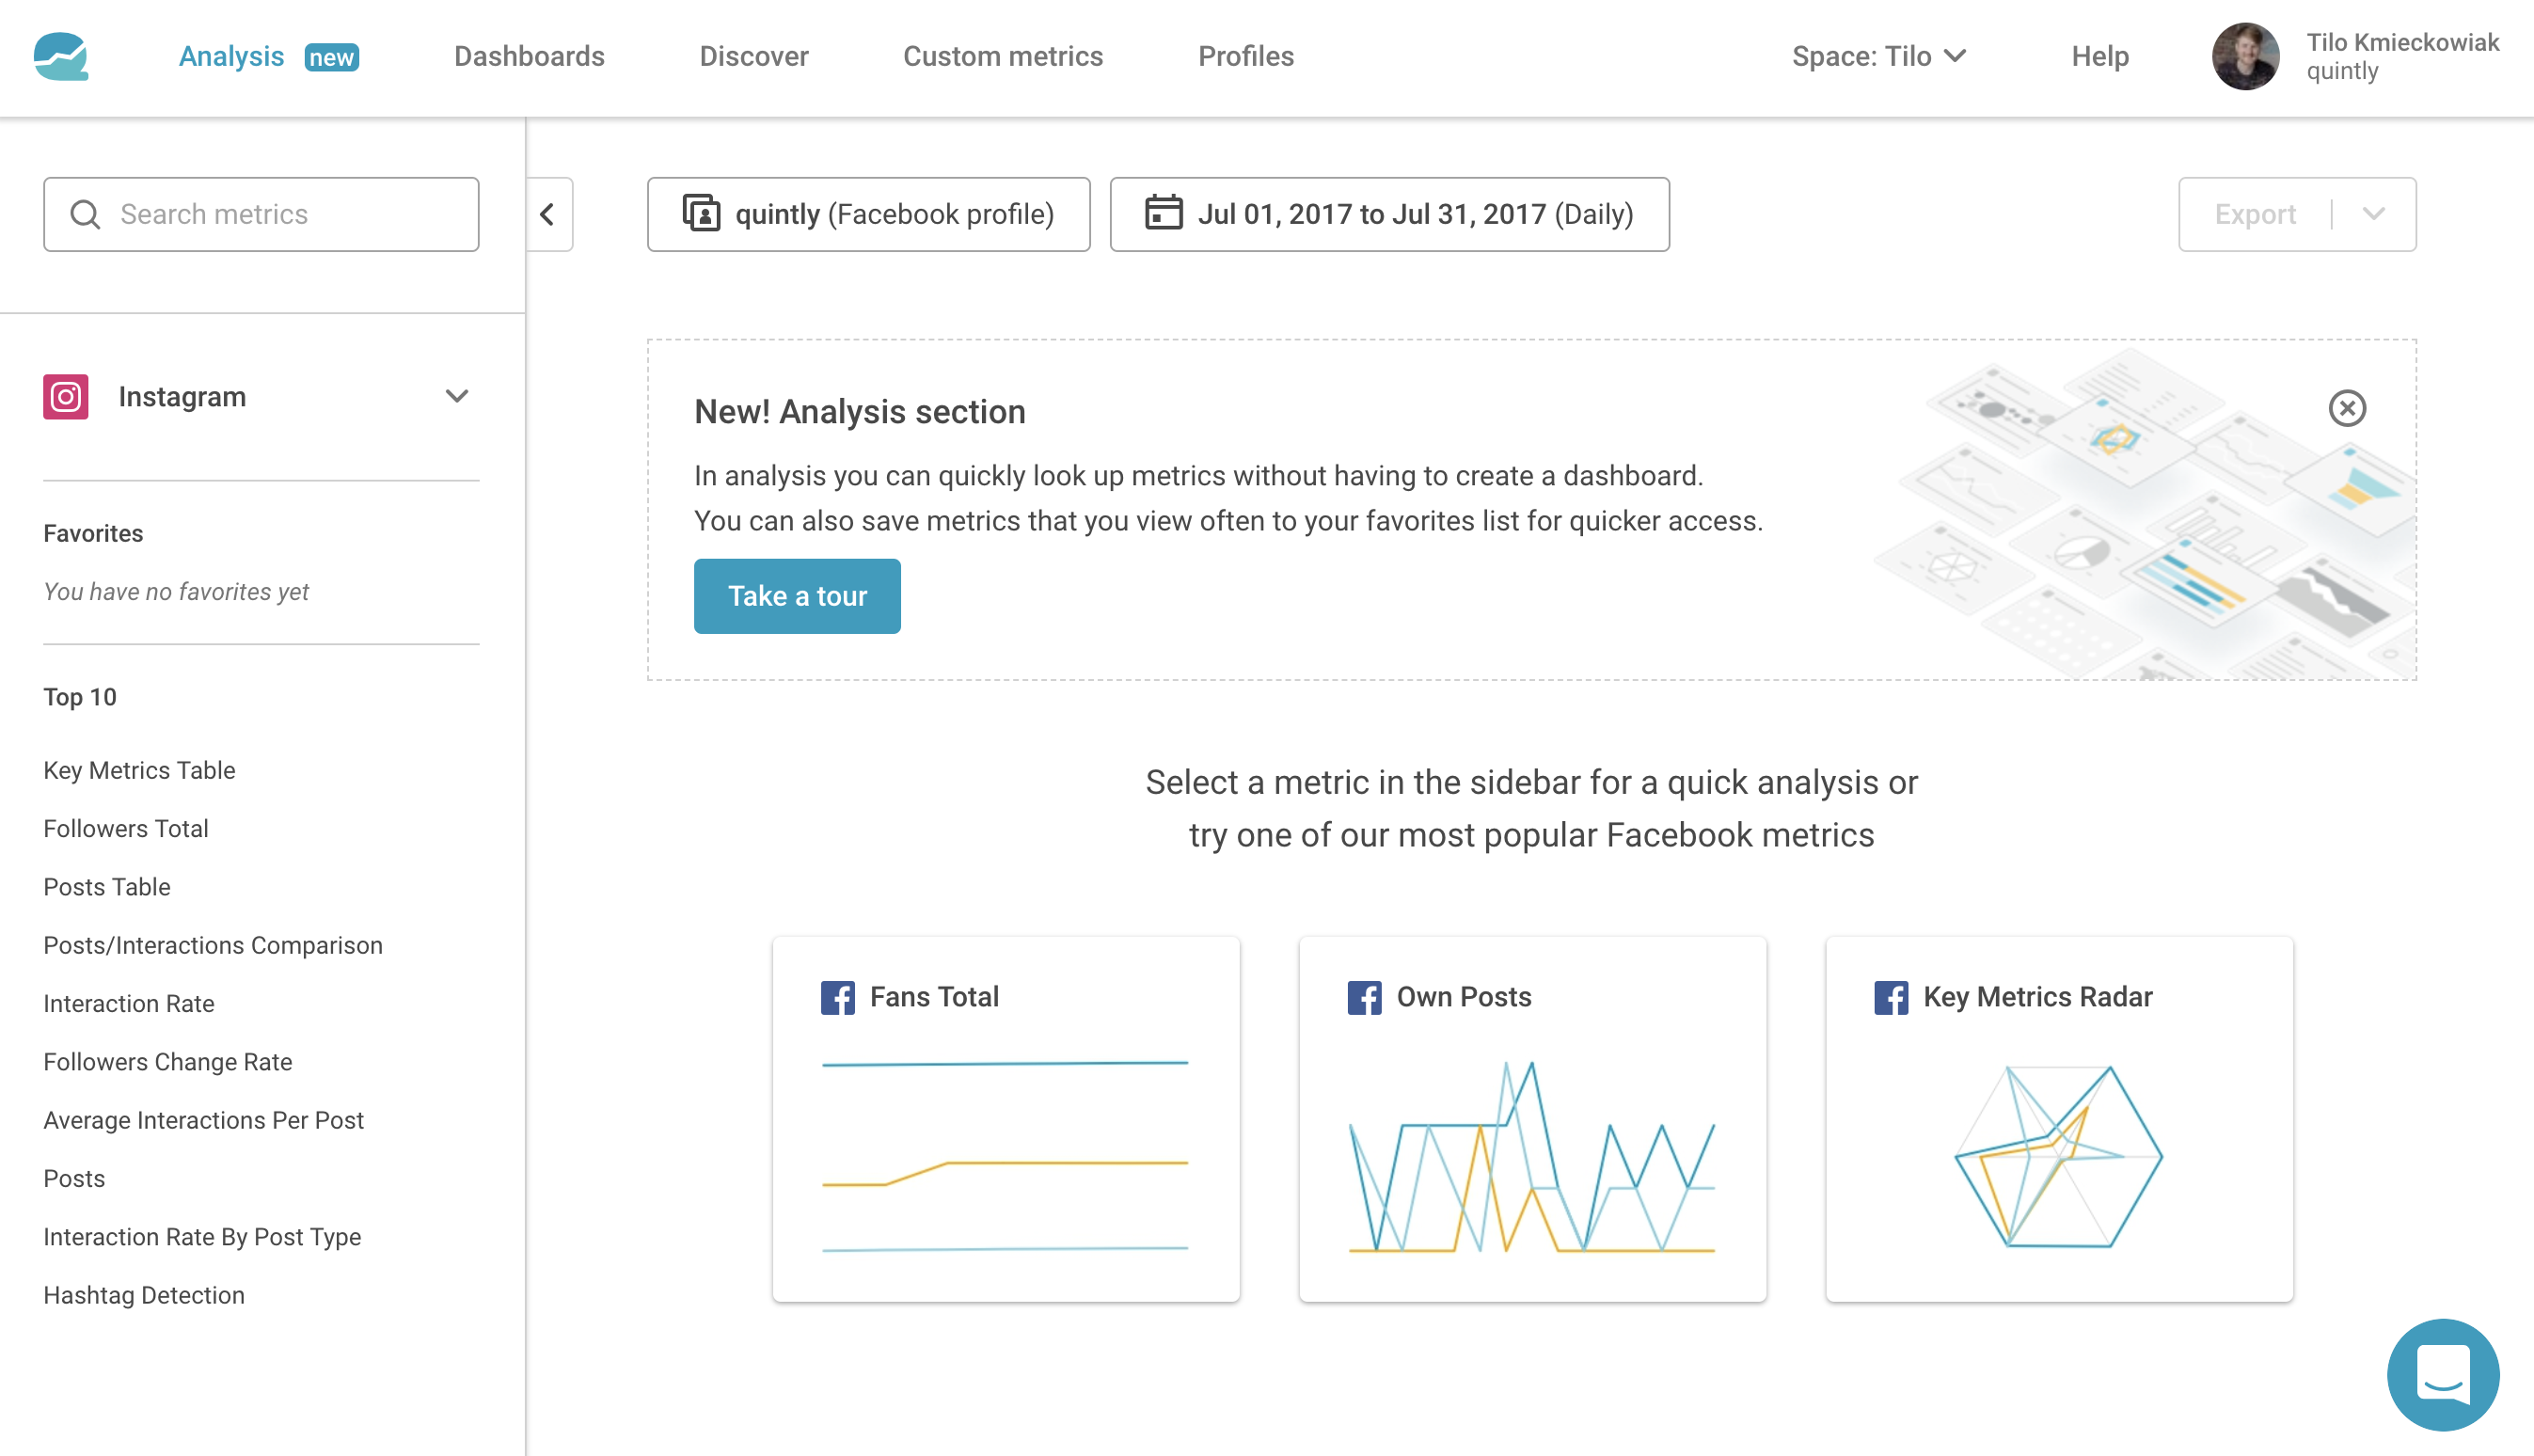
In certain cases, however, it’s necessary to get a quick look at one individual metric you might already have in mind – this is where quintly’s new Analysis section comes into play.
Measuring specific data has become even easier
Let’s imagine a social media marketer called Emma. One day her colleague Phil, who works as a content marketer, comes to her desk with a question on his mind. Phil read on a social marketing blog that recently Instagram users tend to interact less with content. He knows that lots of his content gets shared there so he wants to get some insights.No problem for Emma! She is an avid quintly user and already has access to the new Analysis section. From Phil’s question she knows that he asks about Instagram data, the average interactions per post of their profile specifically. Emma goes to the Analysis section, selects their Instagram profile, types “average interactions per post” in the free text search and chooses a timeframe.
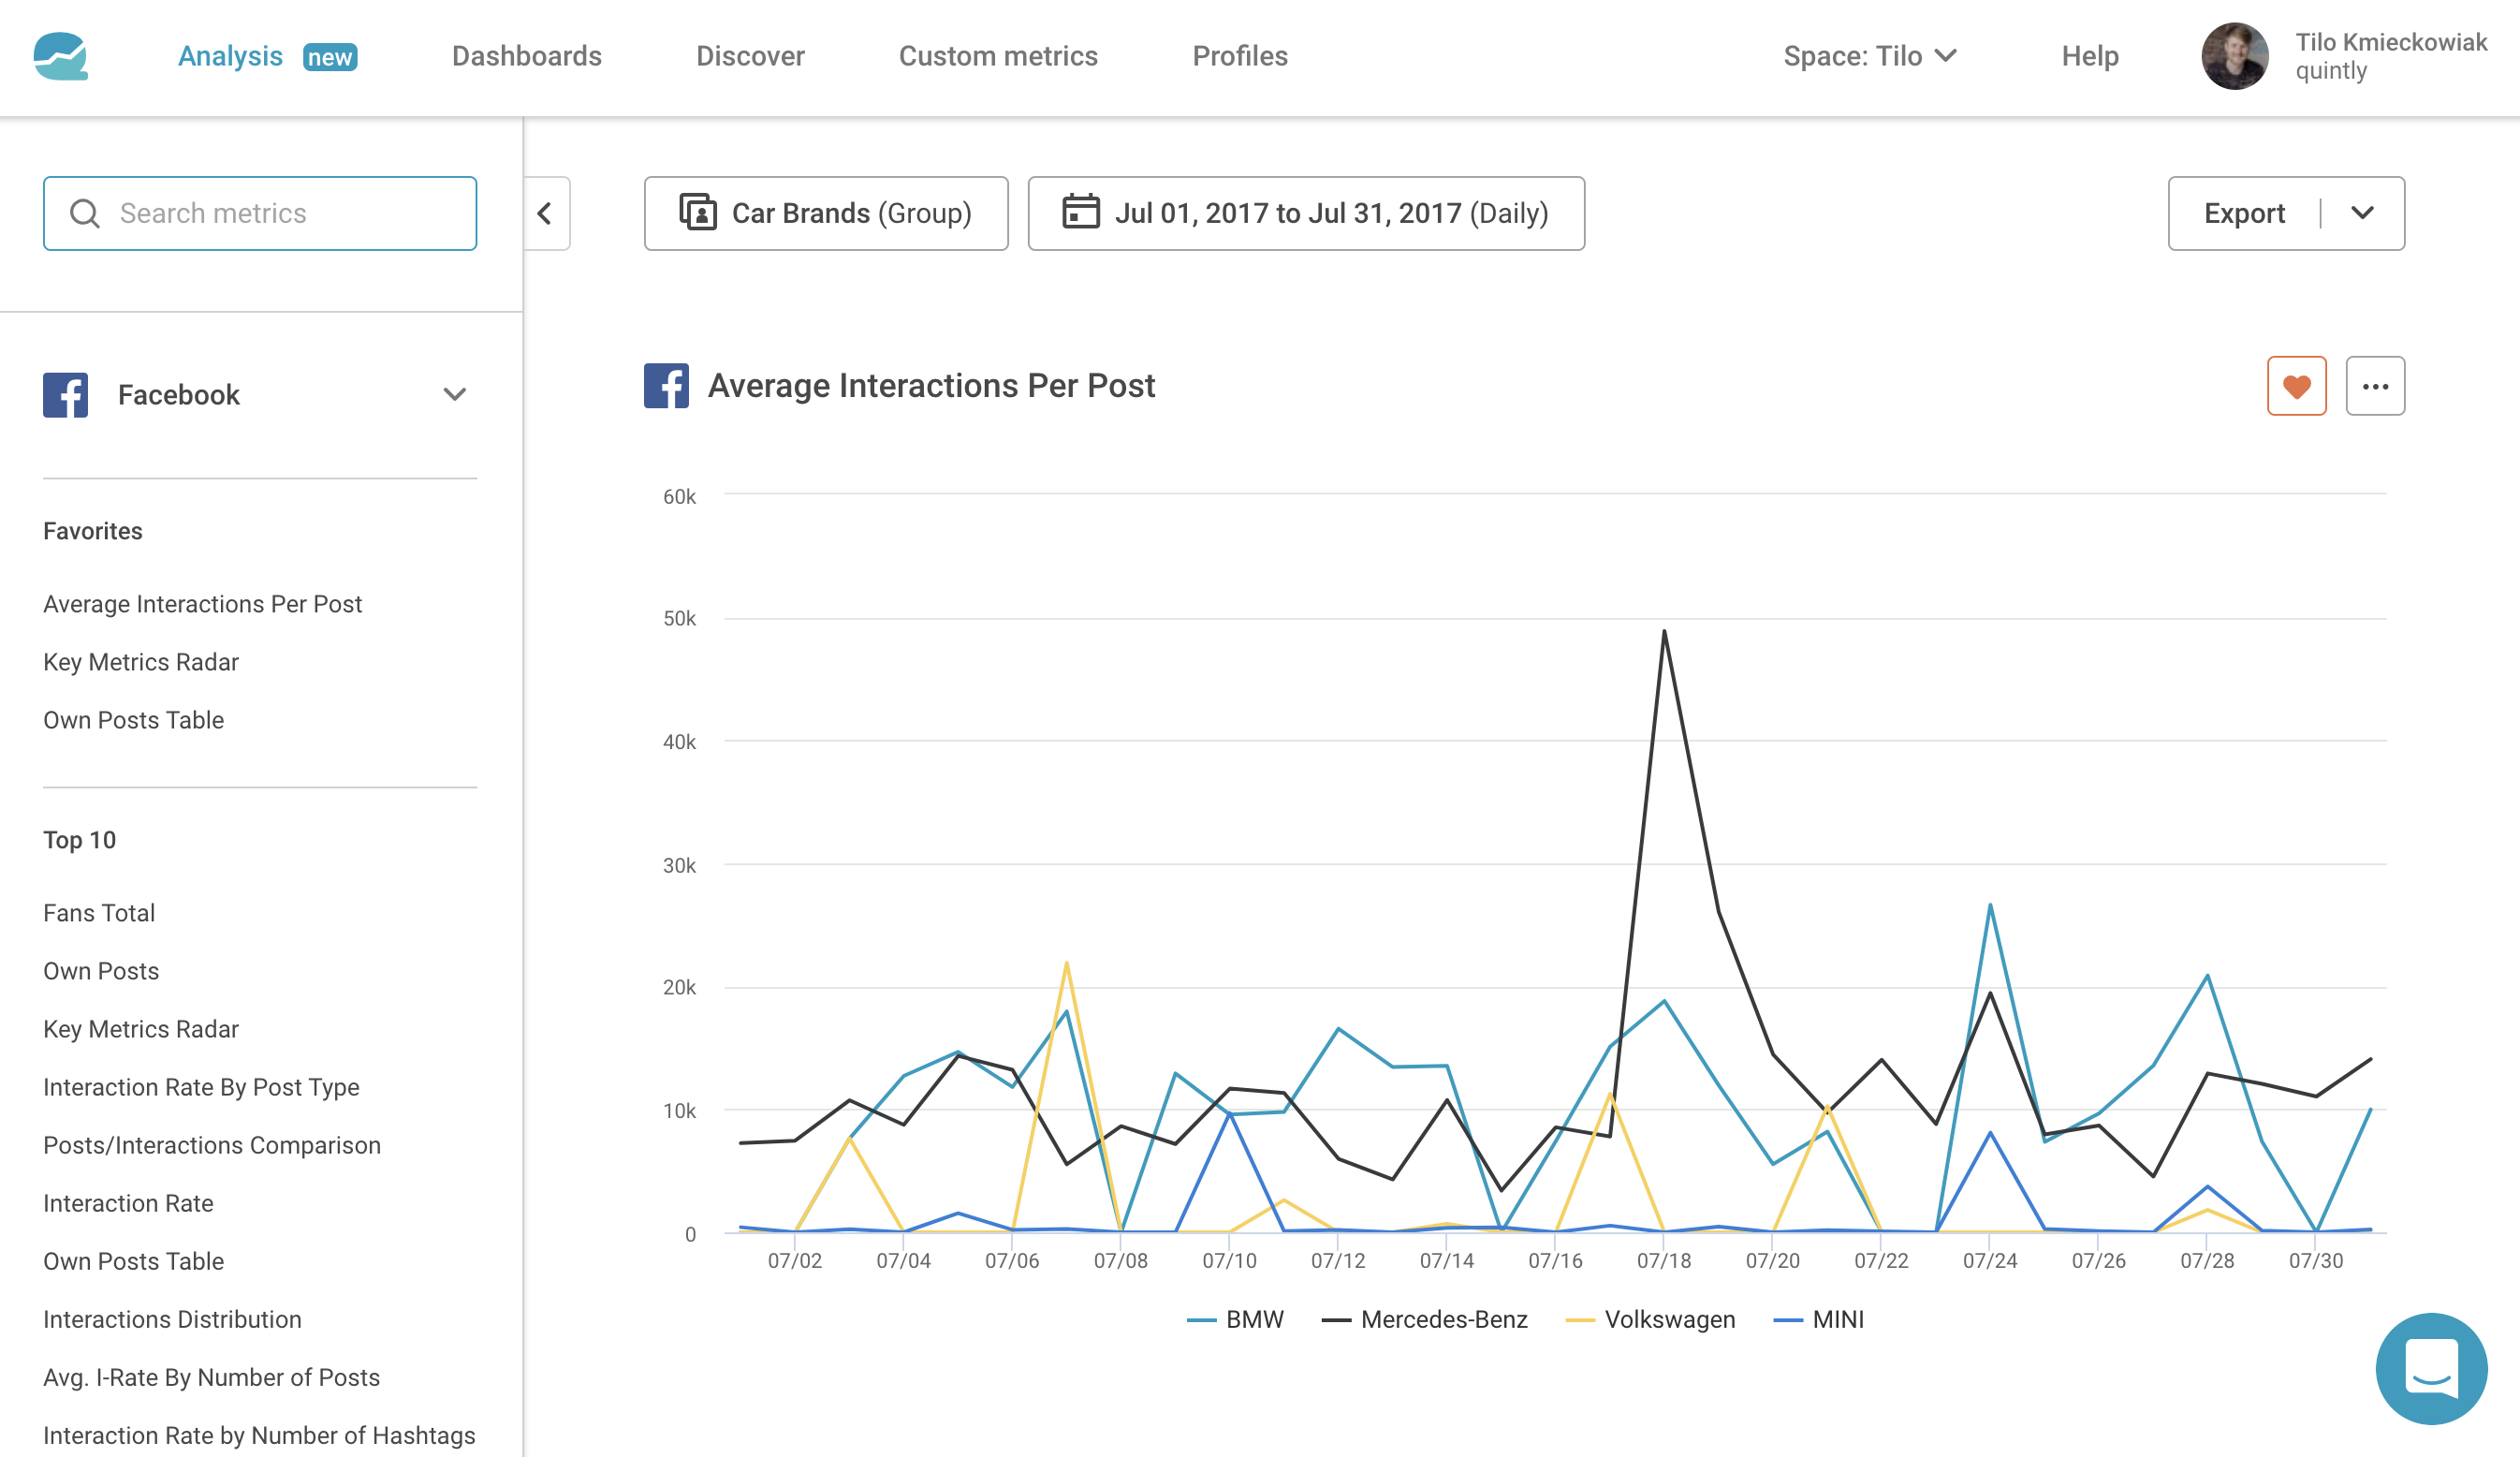
Immediately Emma can see data for this metric. She can then quickly let Phil know that there has been no obvious downward trend for average interactions per post since the beginning of this year – Phil is relieved.
Many new possibilities to get quick insights
After she has answered Phil’s question, Emma has the idea to quickly show Phil some more stats for their Instagram account. She has a look at the left hand column that gives her the top 10 used Instagram metrics by quintly users, where she can directly see the Key Metrics Table, which gives an overview for various basic social media performance numbers.
By clicking on the heart in the upper right hand corner, this metric will be added to her favorites, as she wants to actually look at these numbers a bit more often besides their bi-weekly social media reporting.
In case Emma wants to send interesting findings directly to her colleagues, she can simply export easy to understand graphs in common formats like JPG, PNG and PDF. The Analysis section also supports all her custom metrics that she has created and incase she stumbles upon a useful new metric, she can save it to an existing dashboard right from the Analysis section.
Try it out now!
With the latest addition to our platform, we offer a new way to quickly analyze the data you want to explore. Find specific metrics within seconds and receive results in no time!
If you are already a quintly user, you can try out the new Analysis section just by clicking on this link. We have prepared a tutorial for you that you can access directly within quintly.
In case you aren’t with us yet and are interesting in testing out our new feature and everything else that quintly offers, feel free to request a demo here.


Join the conversation. Leave us a comment below!