
Why do I need customizable social media reporting?
This post is a summary of the webinar we hosted on October 27 2016. Here you can listen to the recording.
You are currently rocking social by finding and creating the right content, engaging with your followers and seeing your brand grow faster. Now, it is finally time to create a social media report to present your outcomes of the last weeks to either your colleagues, clients or upper management. But crunching numbers in excel and creating some charts can be a drag and very time consuming. So, how can you finally take full control of your reports with spending less time on irrelevant stuff like crushing numbers?
Social media reports are a powerful tool to explain your current progress and keep all important KPIs in one place. At quintly, we believe that a one-size-fits-all approach in social media reporting is simply not efficient, nor effective. You should be the driver of this process and have the full power to choose the most important stats that matter the most to your organization. Think about it: Pre-made dashboards filled with unexchangeable and unnecessary metrics will simply not allow you to take full control of your data, nor will such a dashboard fulfil exactly your reporting needs. Therefore, we try to make this experience as easy and flexible as possible. We put you into the front seat of social media reports so that you can take full control of your data by having the chance to fully customize your reports.
How to take full control of my social media reports?
The simple answer to this question is: the power of customization. With quintly, you can use various features to fully customize your reports. Here are some examples to get started:
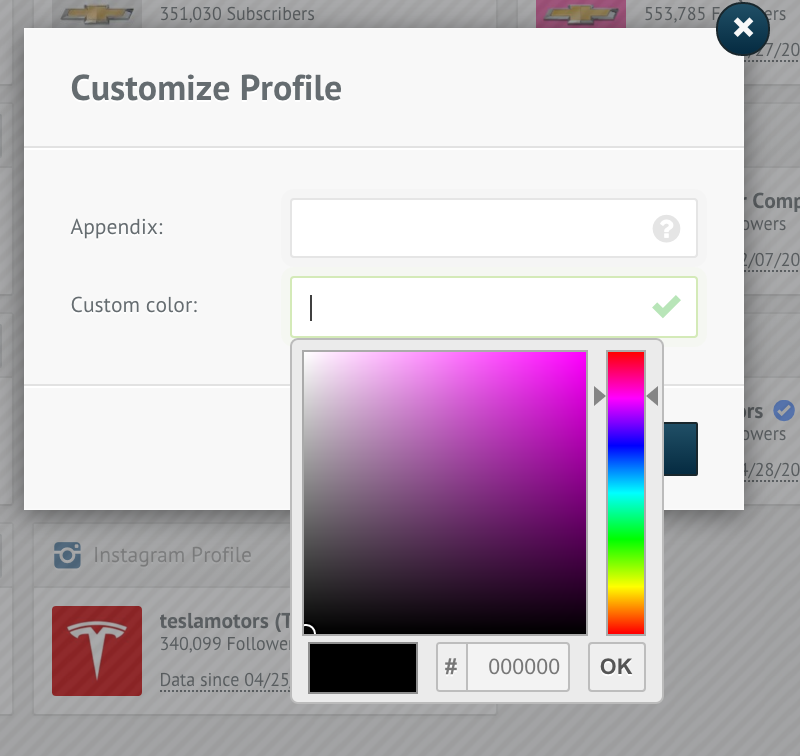
Adjusting profiles
The Custom Colors feature will allow you to change the colors of your graphs, bar charts etc. This feature helps you match the graphs to your own (or your competitors’) Corporate Identity, as well as agencies can do this individually for each of their clients.
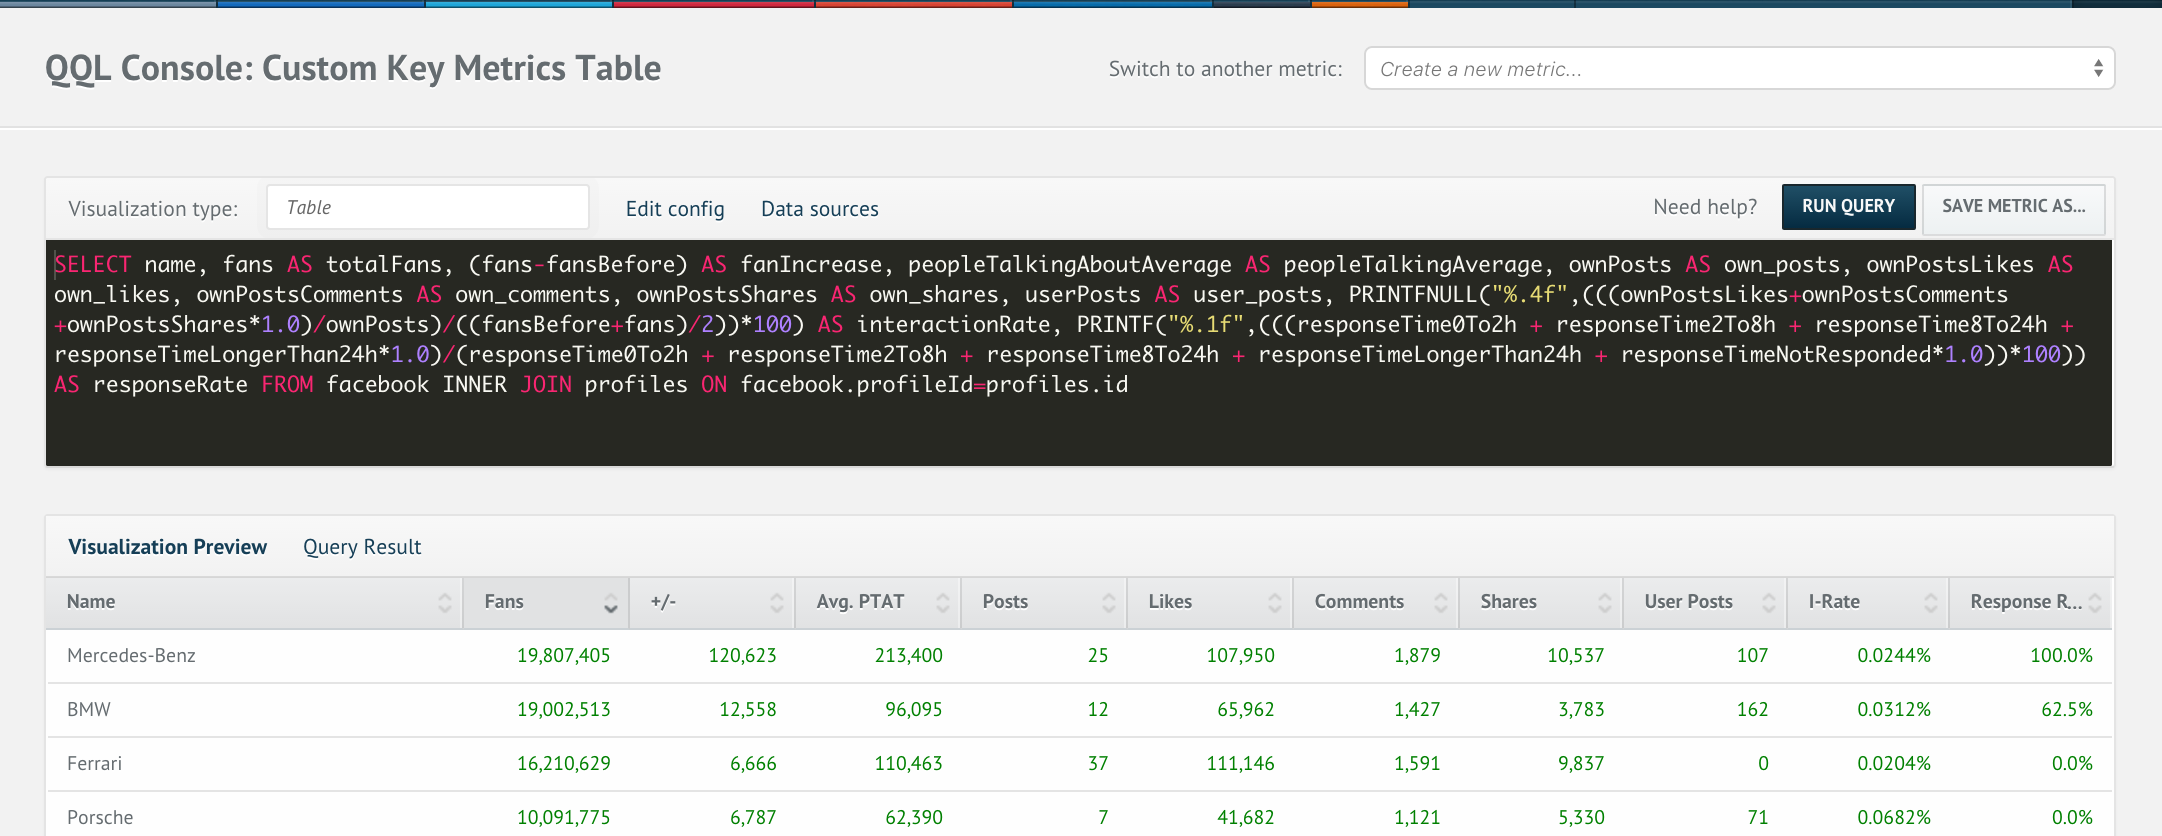
Adjusting metrics
We offer over 250+ pre-made metrics to help you analyze your social media data. The quintly Query Language (QQL) gives you the power to either customize one of our 250 metrics or create your very own metrics to fit your social media analytics needs.
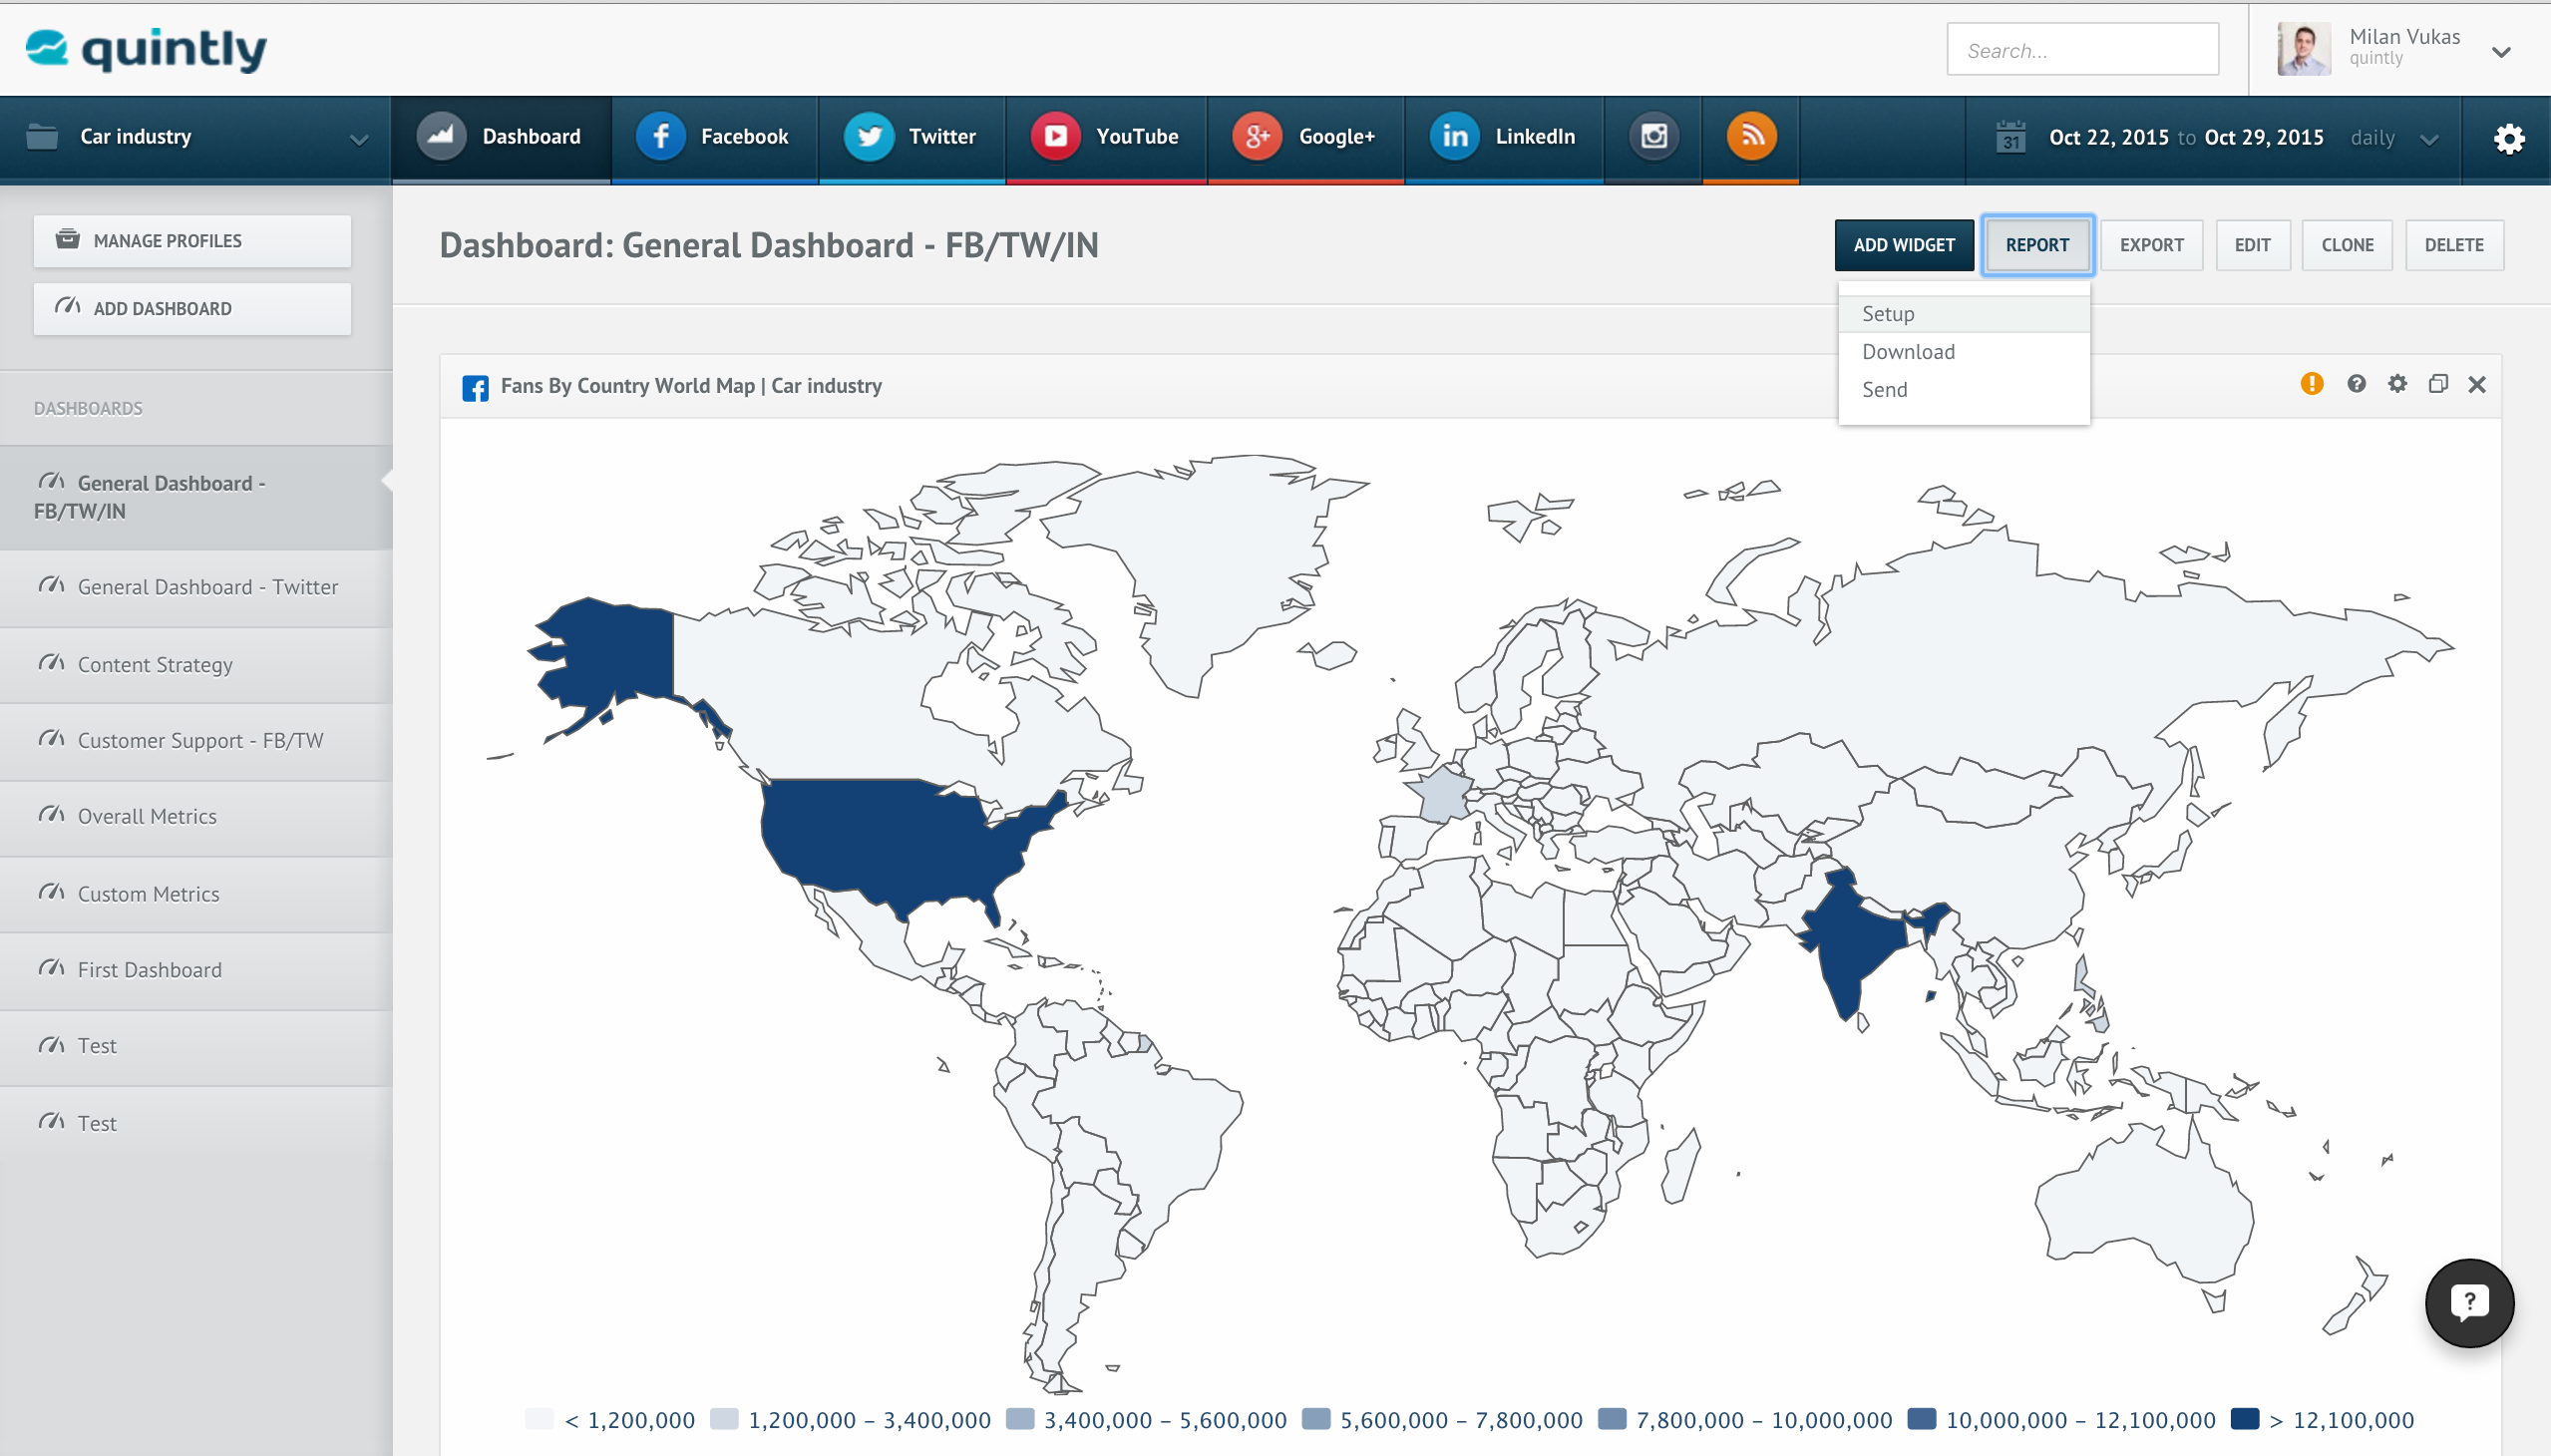
Adjusting dashboard widgets
Every metric which is added to your custom dashboard can be adjusted. There several changes you can make, which all will be visible in either your dashboard exports or the automated reports.
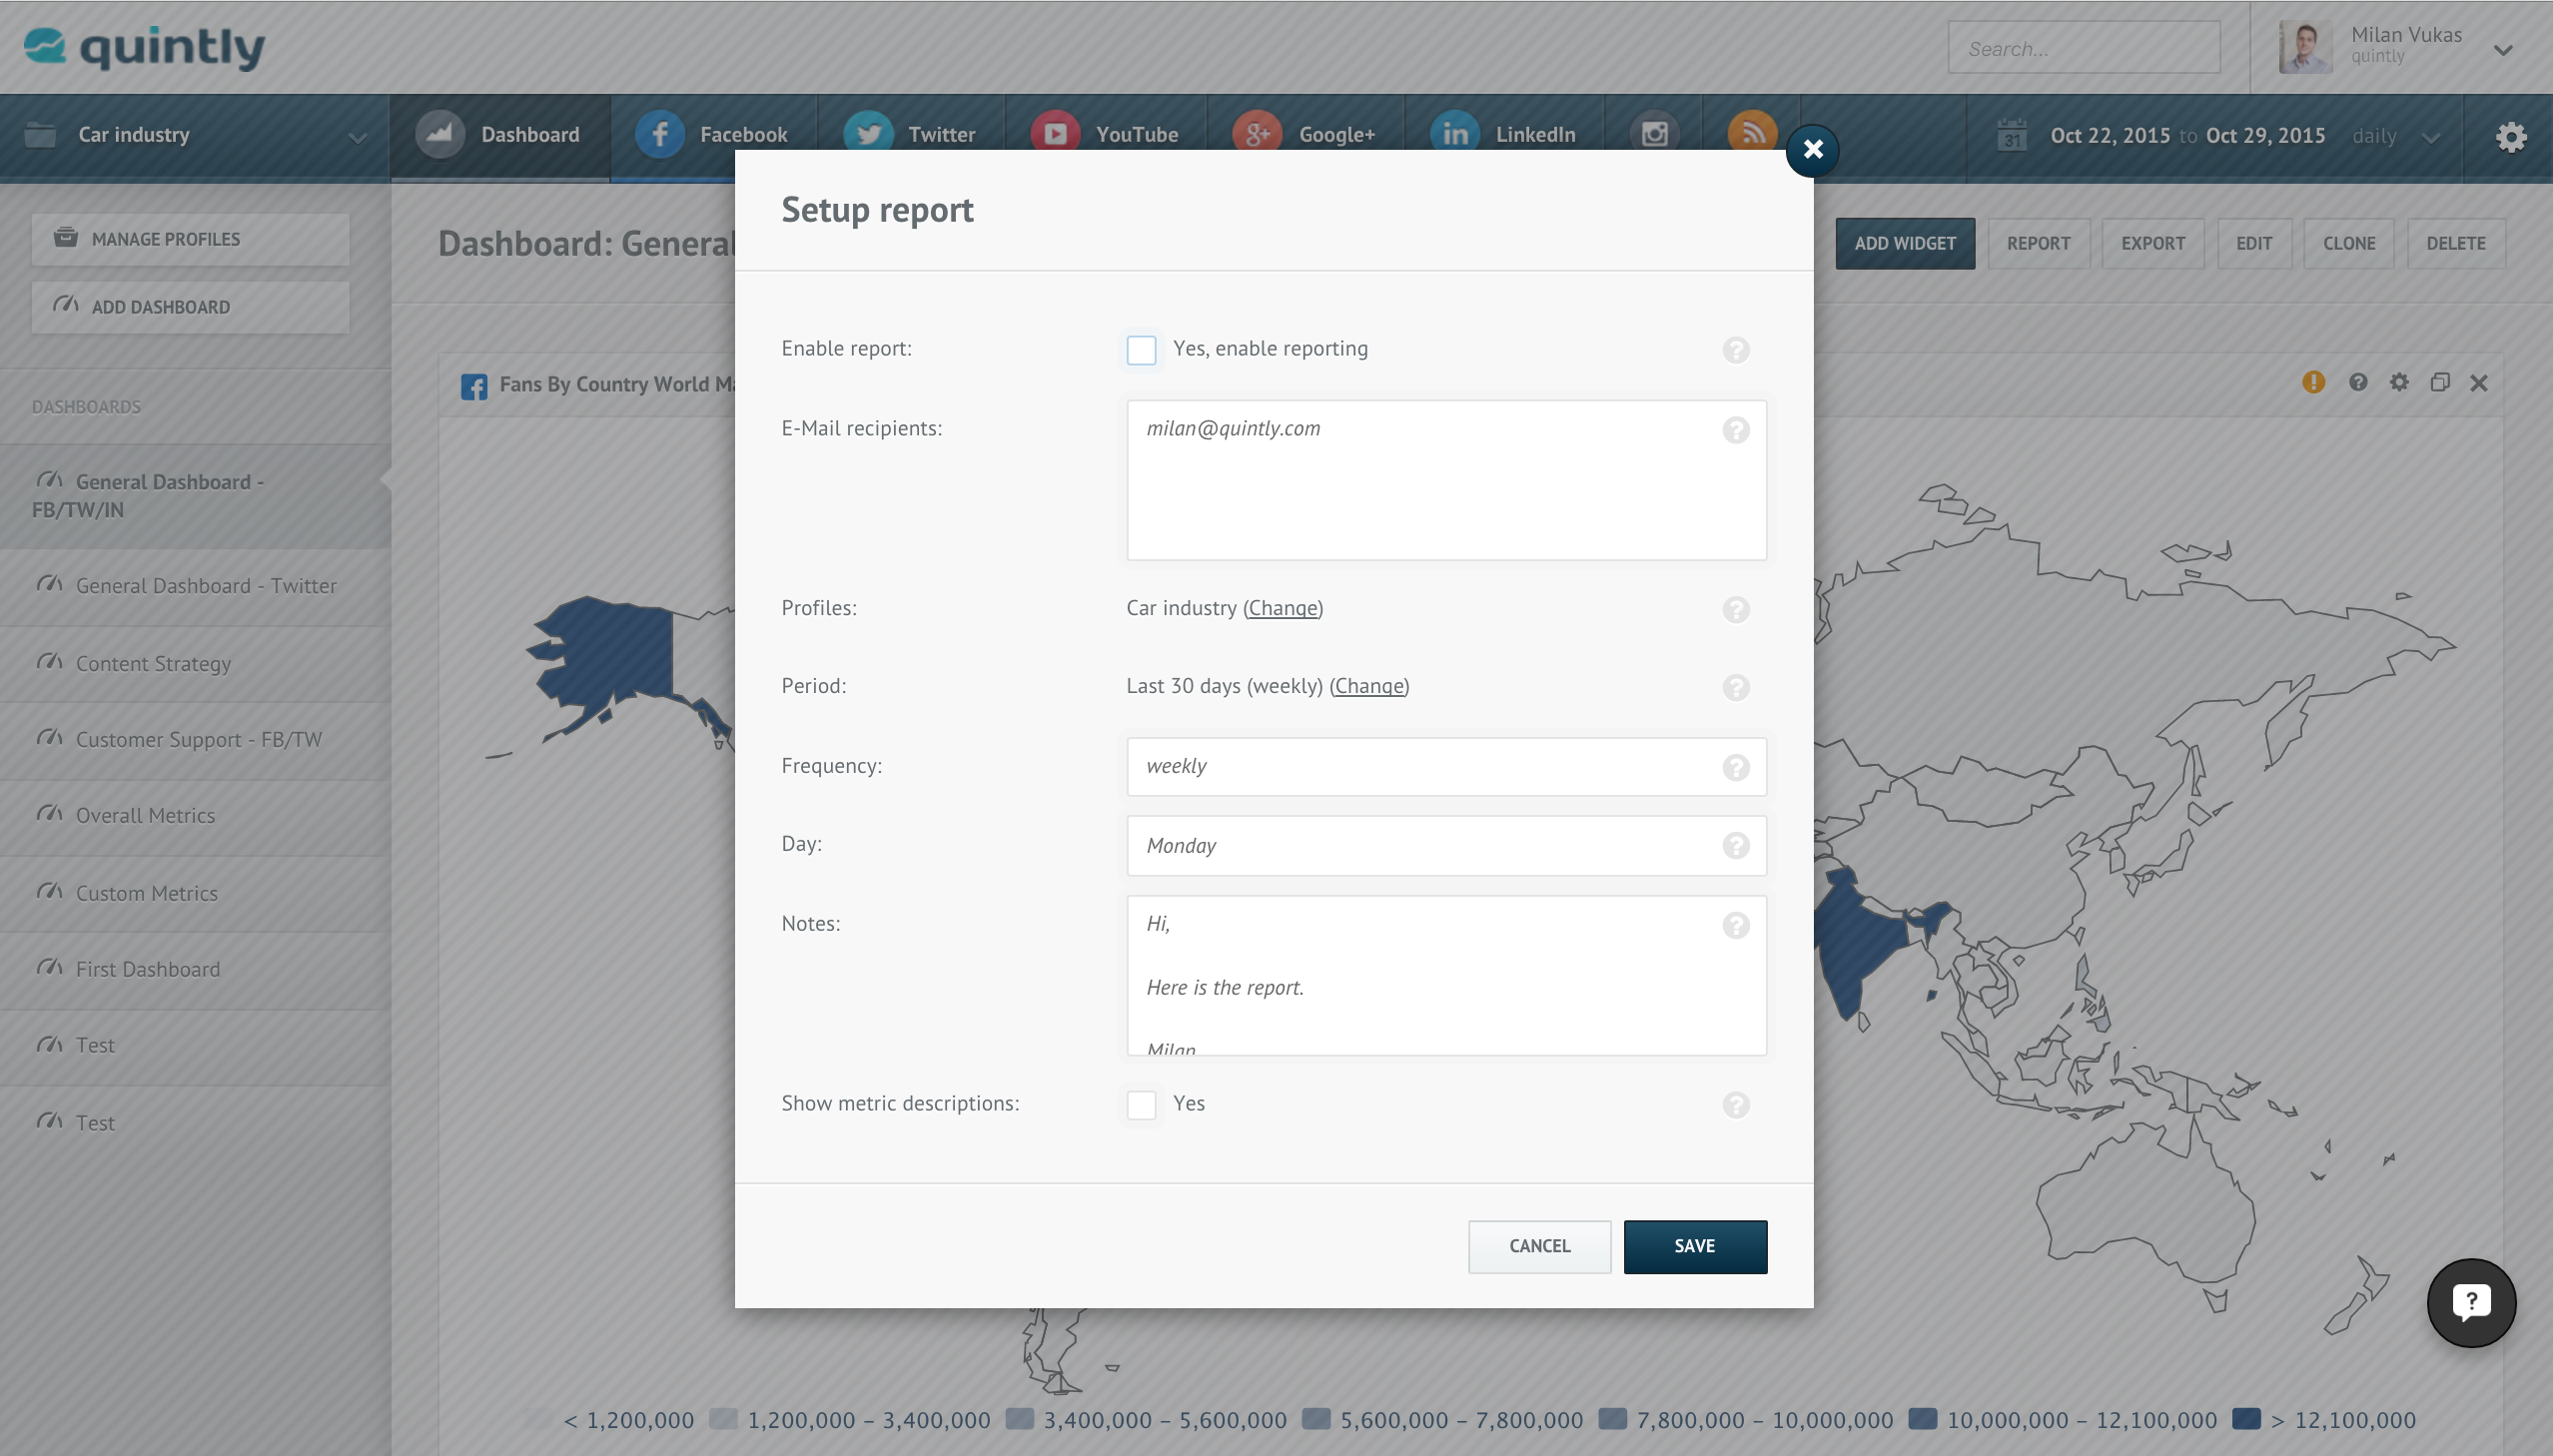
Automating your report
Once you have fully adjusted your custom dashboard, you can setup a report automation which will ultimately help you to inform all involved parties on a daily basis about your company’s social media marketing performance. This especially applies to those colleagues or partners (i.e. your CEO, director or client) who do not work directly in social media marketing. With quintly it is easy to create simple, comprehensive and automated reports. On top of that, our efficient report engine facilitates the creation of reports with your own white-label templates.
If you want to know more about how to set up a social media report, check out this in-depth article.

Join the conversation. Leave us a comment below!