Reach vs. Impressions ⚔️
To win the game of social media, you need eyes on your content. Read on to learn the difference between impressions vs reach and how to track them.
You’ve probably wondered whether enough people are seeing your social media content. You know that more views lead to more likes, shares, and comments which, in turn, lead to brand awareness and conversions.
To judge the success of your social media marketing campaigns, you need to measure how many people, on average, see your posts. Impressions and reach are the two metrics that can tell you.
Reach and impressions both reveal how much exposure your content gets, but they aren’t quite the same thing.
In this article, we’ll clearly define the difference between reach vs impressions, and explain how each metric is measured on various social media platforms. We’ll also show you how (and why) to track both these metrics in Facelift Data Studio, and provide a few tips to boost your impressions and reach on Facebook, Instagram, Twitter, LinkedIn and YouTube.
Need a robust analytics tool to track not only reach and impressions but all the social media metrics that matter? Book a demo now.
Reach vs. impressions: what’s the difference?
Each social media channel measures reach and impressions in a slightly different way. But, to give a general definition of the two metrics;
Reach = the number of individuals or users who see your content.
Impressions = the total amount of times your content is displayed on a screen.
Let’s have a look at an example.
A Facebook user who follows your page comes across one of your posts in their timeline. Later, your post pops up again when one of their friends shares it. This counts as two impressions. But with these two impressions, you’ve only reached one person. So it only counts once towards your total reach.
Put another way, impressions are the total number of views, whereas reach is the sum of unique views only.
Which is more important to track, impressions or reach?
You can’t track everything, and a key aspect of setting up a marketing campaign is deciding what to measure – prioritizing the metrics that are most important and relevant to your goals.
That said, impressions and reach are crucial metrics for any social media campaign. They provide a good starting point and can help you understand the bigger picture.
By tracking impressions and reach, you’ll be able to find out:
- How many people see your content.
- How often your content shows up in timelines, either as an ad, a shared post or organically.
- Whether social media algorithms consider your content relevant and engaging enough to serve organically in people’s timelines.
- How many people see your content more than once. Impressions will always be higher than reach. By comparing the two metrics, you can work out if a lot of people are seeing your posts multiple times.
Plus, when you combine reach and impressions with other metrics, you can calculate your engagement rate and the ROI of paid ads.
Now we’ll explain how to calculate and track reach and impressions on each channel.
Reach vs. impressions on Facebook
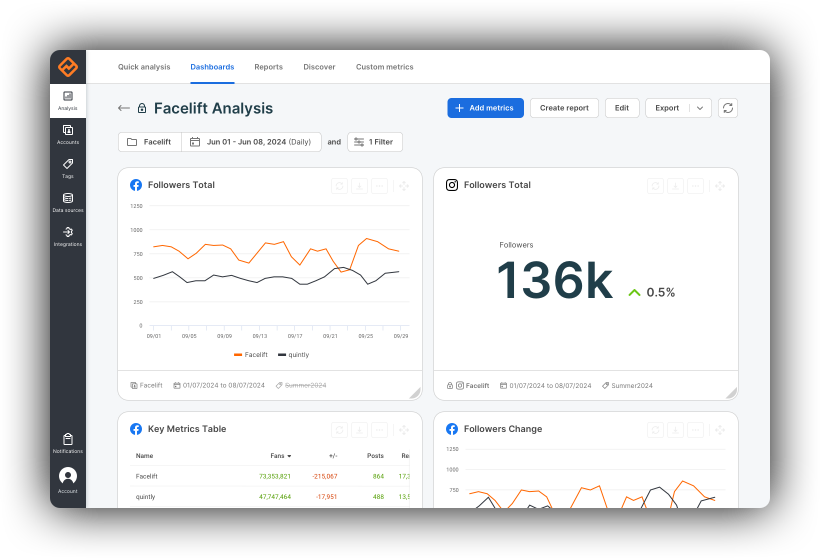
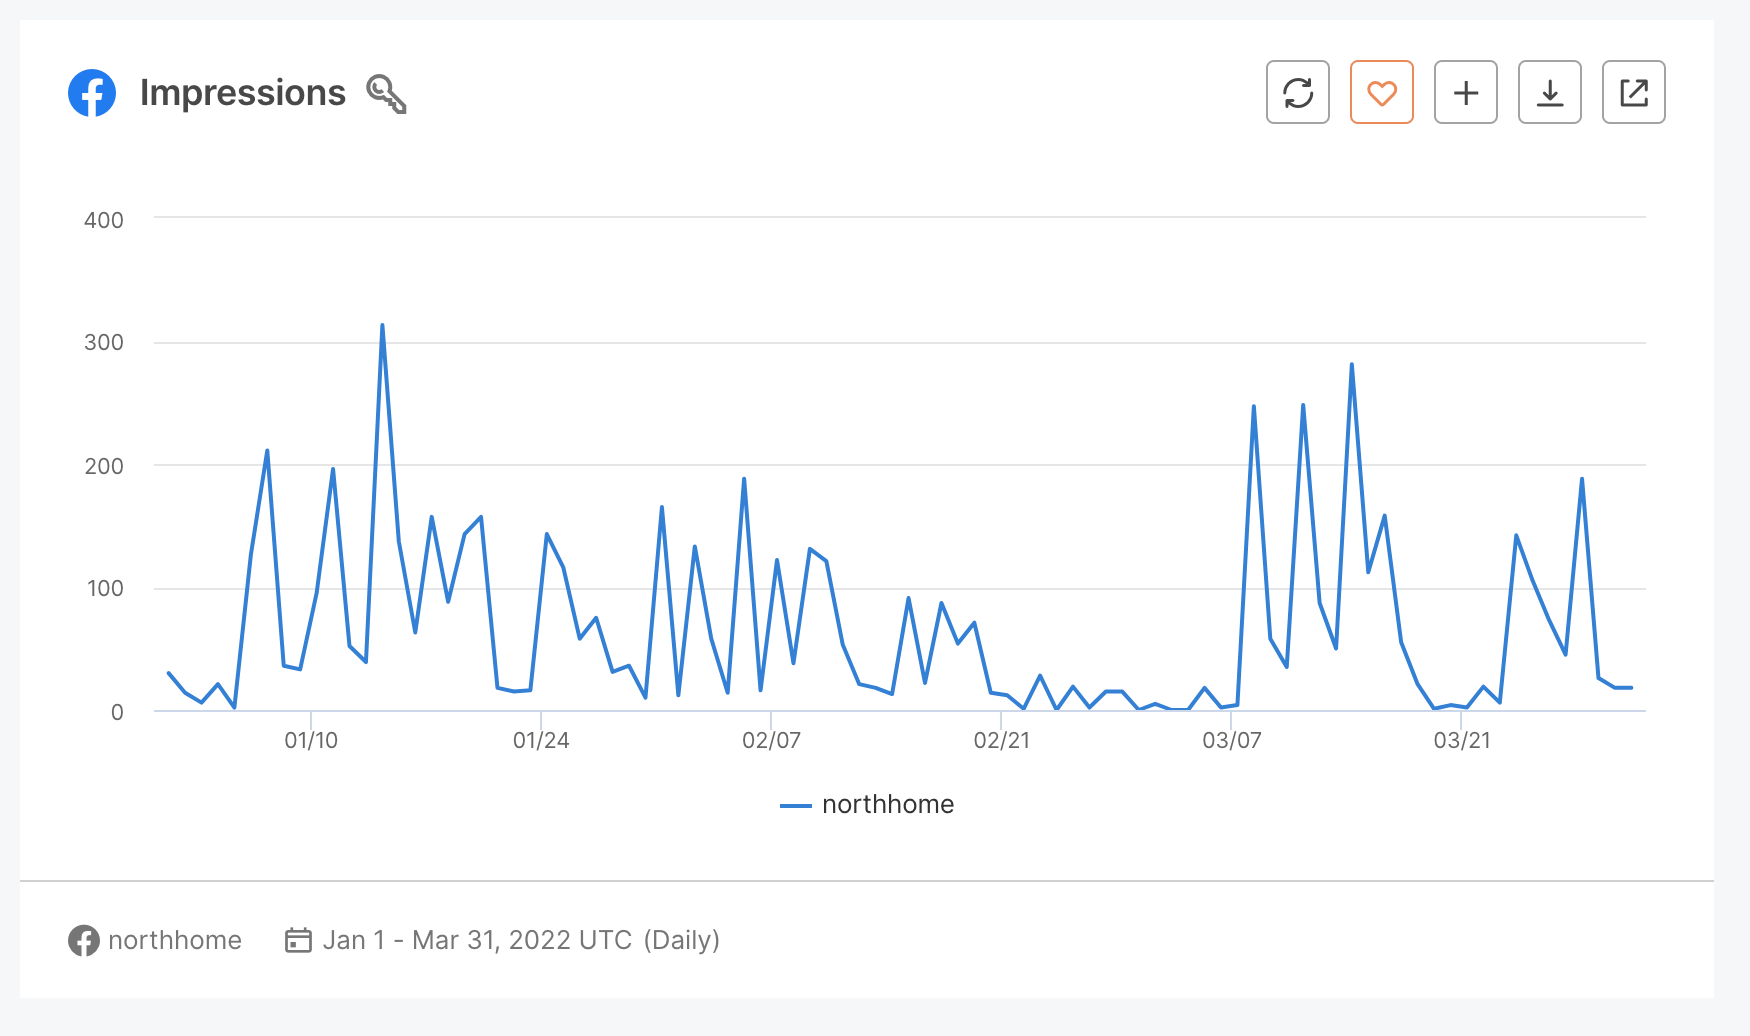
On Facebook, impressions are the total number of times any content from your page, or about your page, appears on someone’s screen. You can see how it develops over time with this graph.
Facebook reach is the number of users who see your content in their news feed, on your page or in a story or ad. Facebook tracks reach in daily, weekly, and 28-day intervals, though on Facelift Data Studio you can choose the timeframe you want to track.

There are two kinds of Facebook reach: post reach and page reach. Post reach is how many people saw a specific piece of content, and page reach is the reach of the page, and all its content, as a whole.
To calculate your average page reach, you would divide the average number of users reached per post by the number of total page likes.
We can also split Facebook reach into a further three categories:
- Organic reach is when your content shows up naturally in someone’s feed.
- Viral reach refers to the number of people who saw your post because it was shared by someone else.
- Paid reach is the number of people who see your ads or sponsored content.
You can compare all three types of reach in Facelift Data Studio.

Facebook also divides impressions the same way, so you can track organic, viral and paid impressions from sponsored or shared content.

To learn about your audience and understand who sees your content, you can check Reach by Country which tells you the geographic location of your viewers.

Reach by Age and Gender is another metric for getting to know your Facebook audience better, and see if your content is reaching the intended demographics.

Tips to increase your Facebook reach
- Mix up different post formats. Try using stories, images, videos, and live streams. You can monitor which ones are most popular using Facelift Data Studio’s Reach by Post Type metric.
- Create native content where possible. Facebook’s algorithm will most likely prioritize a Facebook video over a post with a link to a Youtube video.
- Experiment with posting at different times until you find the best time to post for maximum engagement.
- Target the right audience with your paid campaigns. Facebook lets you customize the intended audience for your ads, so you can make sure to align this with your target customer persona.

Reach vs. impressions on Instagram
Instagram reach is the number of individual Instagram users who see your page or post. Impressions are the total number of views your page or post receives.
Many people wonder what counts as a good reach on Instagram, but there’s no simple answer.
A 2019 study found that average reach decreases as follower count rises. An Instagram account with under 10,000 followers will reach 26.6% of its followers with each post, on average. However, accounts with over 200k followers can expect an average reach of only 13.8% on their posts.
Another thing to consider when creating your Instagram strategy is that posts get more reach than stories. This is because posts can be found on the “discover” page by anyone, even people who don’t follow you.
You can get an overview of how your Instagram posts are performing with Facelift Data Studio’s posts table metric.

To spot trends and identify the best times to post, you can use Organic Reach by Weekday to see how much reach you get on different days of the week. This can help you plan and schedule your posts ahead of time.

On Instagram, hashtags are a useful tool to introduce people to your content and gain followers. Facelift Data Studio allows you to track your content’s performance according to the hashtag used.

By comparing impressions with engagement, you’ll see what percentage of people interact with your posts after seeing them.

Tips to increase your Instagram reach
- Add hashtags to your posts. Hashtags help Instagram’s algorithm categorize your content and give you the opportunity to attract new followers through the discover page.
- Use different features. Instead of just sticking to posts and stories, try making reels, videos and experimenting with any new formats that Instagram launches.
- Keep an eye on the types of content that receive the most likes and engagement. Double down and create more of these kinds of posts.
- Create beautiful content. It sounds obvious, but Instagram is a highly visual platform. Users love to see beautiful photography, well-edited images and videos. Keep the quality of your posts consistently high.
Reach vs. impressions on Twitter
Twitter impressions are the number of times a tweet is viewed either in Twitter timelines or search results. Impressions include views of a post’s retweets, but tweets viewed on third-party platforms or websites are not included.
If one person sees your original tweet and later sees a retweet in their timeline, this will count as two impressions.
Instead of reach, Twitter tracks unique impressions. Ultimately this amounts to the same thing - the number of users who view your tweet. To calculate your reach rate, you can divide your impressions by your number of followers.
In Twitter Analytics, you can view your impressions over the past 30 days or the last 3,200 tweets.
You can also use Facelift Data Studio’s impressions count to see total impressions and the increase or decrease over time as a percentage.

Impressions Over Time shows you the impressions on all your tweets posted within a certain time frame

You can look at your Daily Average Impressions Per Tweet to see how tweets perform on a typical day.

Engagement and impressions are closely related. Increasing engagement often leads to more impressions, and vice versa. You can compare these two metrics with the Impressions/Engagement comparison graph.

Tips to increase your Twitter reach
- Build connections. On Twitter, the best way to grow your following and establish trust is by having genuine, back and forth conversations with your followers and other relevant or related brands.
- Consistency is key, so tweet and reply often.
- Get involved in conversations about trending topics, where it’s relevant to you. You can even make jokes based on trends and memes, as long as it feels appropriate and “on-brand”.
- Put some effort into formatting your tweets. Don’t just post a wall of text. Instead, use spacing, bullet points, emojis and images to make your tweets more engaging. If you’ve got a lot to say, split long text up into a Twitter thread.
Reach vs impressions on LinkedIn
LinkedIn counts impressions any time your content is at least 50% in view for 300 milliseconds, on a signed-in member’s device screen or browser window.
Unique impressions, aka reach, are the number of individual LinkedIn users who see your content. LinkedIn also differentiates between organic and paid impressions.
When you’re looking at LinkedIn articles and video posts, it’s important to note that there’s a difference between an impression and a view.
If someone watches your video for at least 3 seconds, that counts as a view. For articles, a view is anytime someone clicks your article and allows it to load fully.
You can track LinkedIn impressions over time to see whether your impressions are increasing.

Facelift Data Studio’s Key Metrics Table for LinkedIn is an overview of common KPIs at post level, including Impressions and Average Impressions.

By looking at Post Impressions, which shows how many impressions you’ve received on individual posts, you’ll be able to see what posts have been most successful.

Tips to increase your LinkedIn reach and impressions
- Get the timing right. LinkedIn is a professional social network, and most people are active there during the workweek. So, avoid posting content on weekends or in the evenings.
- Optimize your profile. You are more likely to grow your following and increase your reach if you have a fully completed profile for your company, and you respond to requests and messages.
- Get your team members to interact with your posts. Early engagement can help boost a post’s organic reach.
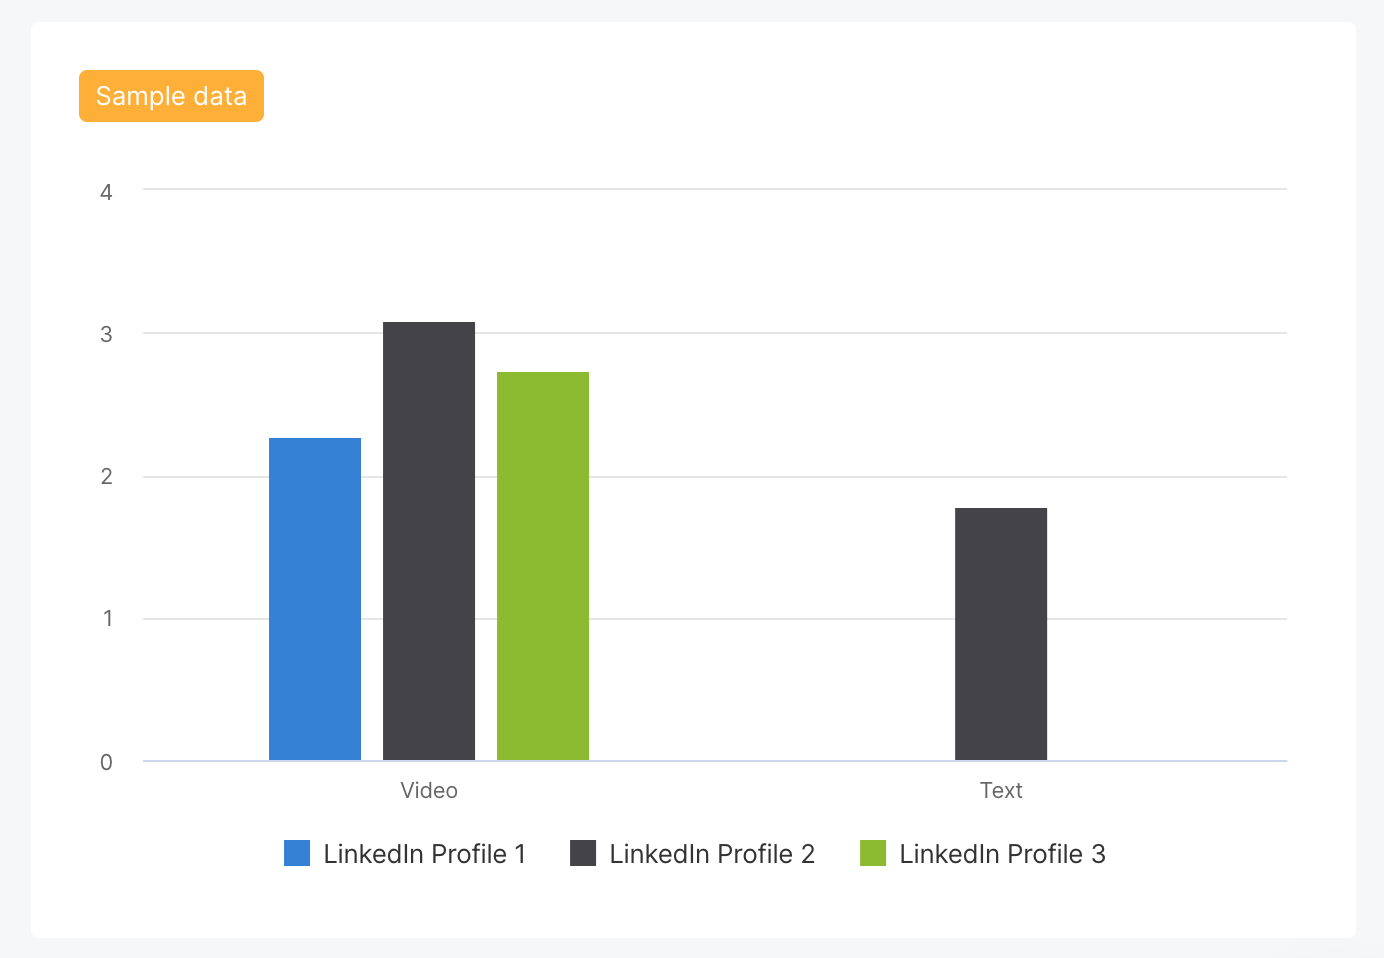
- Try different content formats, like articles, videos, polls and documents. You can use the metric Interaction Rate by Post Type to see which ones are most successful.
Reach vs impressions on YouTube
Impressions mean something slightly different on Youtube compared to other channels. On Youtube, impressions are the number of times a video’s thumbnail is displayed. There’s no distinction between reach and impressions, and video clicks and views don’t count as impressions.
An impression counts anytime the thumbnail is at least 50% visible on a screen for at least a second.
Youtube counts impressions when content is displayed on various devices like PCs, TVs, game consoles and mobile devices.
Impressions don’t count for YouTube videos embedded on external websites or email, or when they show up on YouTube’s mobile website. However, views do count from embedded videos.
You can only track impressions with YouTube’s native analytics. However, you can look at other metrics in Facelift Data Studio to analyze your performance on youtube.
The Key Metrics Table gives you a summary of important YouTube data.

You’ll want to know who watches your videos, and Facelift Data Studio has a few metrics that can help you get to know your audience. As well as tracking the age, gender and location of your viewers, you can see how viewers arrive at your video using Traffic Sources Breakdown.
Though you can’t track reach and impressions with analytics tools, Facelift Data Studio is one of the few tools that includes most YouTube studio metrics. Find out how to track audience demographics, subscriber data, premium metrics and more with Facelift Data Studio.
Tips to increase your YouTube reach
- Create an attractive custom thumbnail. Thumbnails help you increase your clicks, views and impressions. Instead of leaving the default thumbnail, which will be a random still from the video, create a custom image with title text. Keep all your thumbnails consistent with your brand image.
- Choose a good keyword to use in your title and description to help your videos rank high up in YouTube search.
- Use catchy titles and audience-centered descriptions that people will want to click on. For example, tease what you are going to reveal in the video, and what the viewer will be able to achieve after watching.
How do reach and impressions fit into the bigger picture?
Reach and impressions provide the necessary context to all the rest of your metrics.
For example, let’s say you want to know if you’re getting a healthy amount of engagement on your posts.
First, you need to know how many of your followers see your content in their timelines, and how many people who don’t follow you discover your posts thanks to shares or paid ads.
Engagement rate is important to track alongside reach and impressions, and boosting your engagement rate creates a positive feedback loop. When you get lots of engagement, this tells the social media algorithm your content is interesting. It will then show your post to more people organically in their timelines.
Track reach and impressions with Facelift Data Studio
Winning the game of social media starts with getting your content in front of as many eyes as possible.
If people don’t see your content, they can’t interact with it, and you’ll miss your chance to win them over.
That’s why impressions and reach are the starting point for all your other metrics.
But reach and impressions are just one piece of the puzzle. To truly get the best results from your social media campaigns, the secret is tracking the most relevant data and optimizing every step of the way to improve your results.
With a social media analytics tool like Facelift Data Studio, you can unite all different kinds of data from various sources. When you bring all your multi-channel social media data into a single platform, you have one central place to analyze the success of your campaigns, and make changes when needed.
Facelift Data Studio also “cleans” your data. This means that, although every platform has different ways of measuring some metrics, Facelift Data Studio will convert to a universal format so it’s easy to compare.
You can also create customizable dashboards and plug in the metrics that matter most for your campaigns.

"We use quintly to track social media performance across 100+ social channels and compare global goals across networks in 36 markets. quintly's data insights helped us achieve over 22% growth in year over year reach and 50% in total engagement."

"quintly has become a vital tool for our marketing department for both looking back at our social media performance, but also helping us build a better more educated strategy moving forwards."

"quintly is the best tool for social media channel analysis we've tried so far - and we've tried a lot of tools. It's easy to use, with a wide variety of features and optional custom designed additions, making it optimal for quick overviews as well as in depth analysis."

"quintly is probably my favorite social media analytics service on the web today. It helps me track, benchmark, and optimize my social performance with super-smooth analytics."

"The tool is very flexible and allow us to create our own KPIs, reports and dataset for API exports. The communication between the devs and the customers is very professional. We feel that there are humans behind the machine."