
Now that Instagram is booming and there are over 2 million marketers on the network, optimizing Instagram marketing is vital. As reported already in our Instagram Study 2015, interactions dropped throughout the past year, whereas own posts increased moderately and the frequency of video posts almost doubled. These facts, crowded Instagram timelines and competition force brands to set and measure the right Instagram KPIs to use the network to its fullest.
Instagram KPIs I - Follower Growth
To reach more people somehow every strategy aims towards more followers that are honestly interested in your work or product. Therefore the first two Instagram KPIs we want to discuss are the most important metrics that help to indicate whether you achieved to grow as planned.
Step 1: Identify Development of Instagram Followers
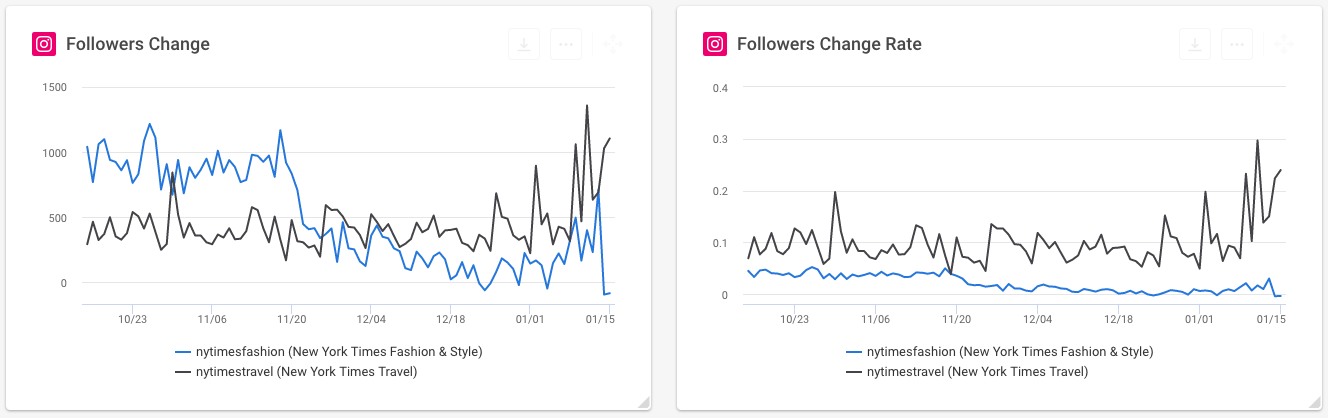
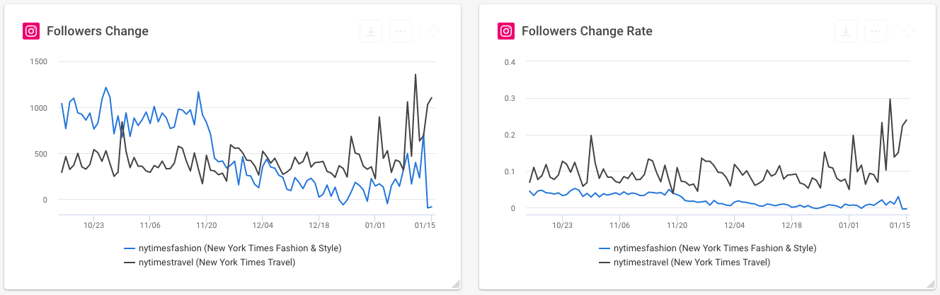
On the screenshot below you can see two Instagram metrics. On the left hand side, the follower change in absolute numbers. This social media KPI is useable when Instagram profiles of different sizes are compared. When different sized profiles are analyzed, the Follower Change Rate allows you to compare the relative change in followers in percent.
In the dashboard used for this New York Times analysis, both metrics make sense. They can just be placed beside each other to be able to gain more insights in the development of the Instagram profiles analyzed.
Instagram KPIs II - Instagram Interactions
Often considered as the ultimate goal in social media is engaging your fans. Businesses invest a lot of time and effort and thus financial resources in high quality content to reach their fans. As we are used to that from Google Analytics, this needs to be done in social media as well. The following social media metrics help you to answer questions like: Which post type receives the highest amount of interactions? When is the best time to post on my social media channels? Which hashtags drive the highest engagement specifically in my strategy?

Step 2: Analyze Interactions per Post Type
In our Instagram Study of 2017 we found that image and video Interaction Rates are equally dropping, whereas videos tend to receive slightly more interactions. Taking that into consideration, it is always worthwhile to take a closer look at the Interaction Rate by Post Type. With this Instagram KPI you will be able to check the interactions on videos and images specifically in the market you are in. Social media studies always look at averages, which is interesting to get an overall understanding of the network. For your social media routine, the performance should be checked specifically, thus analyzing in detail which post type receives the highest amount of interactions is key.
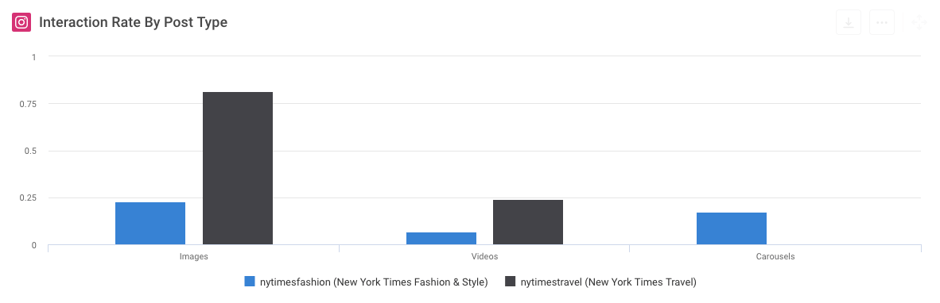
In quintly you will find bar charts comparing the Interaction Rate on your post types in your analyzed group. In this case, New York Times is able to receive a higher Interaction Rate on images than video posts on Instagram.
Our definition of Interaction Rate by Post Type is:
“Get the interaction rate for specific Post types of an Instagram profiles irrespective of their Followers. The result is a combined index of Likes and Comments per Post, standardized by the total amount of Posts of that type and Followers.”
Step 3: Instagram Post and Interaction Comparison
In increasingly crowded Instagram timelines and with ads on the users’ timeline it gets harder to reach your community and easier to get overseen. Thus the timing of your posts need to be carefully considered. Our Post / Interaction Comparison helps you to identify your own posting patterns (or the posting patterns of your competition) and makes it easy to compare at a glance. In the left metric the grey bubbles visualize interactions New York Times received and the blue bubbles own posts (can be seen once again on the right hand side). The area highlighted in orange shows a time where NYT tends to receive relatively more interactions compared to their number of own posts.
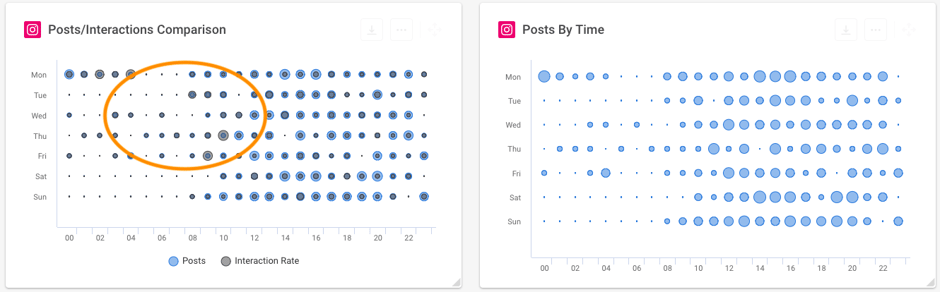
This metric is a very helpful indicator whether you are posting at the right time or if it still could be optimized. To constantly control your social media strategy, Instagram KPIs like this are essential to post at the best possible time in the timezone you are active in.
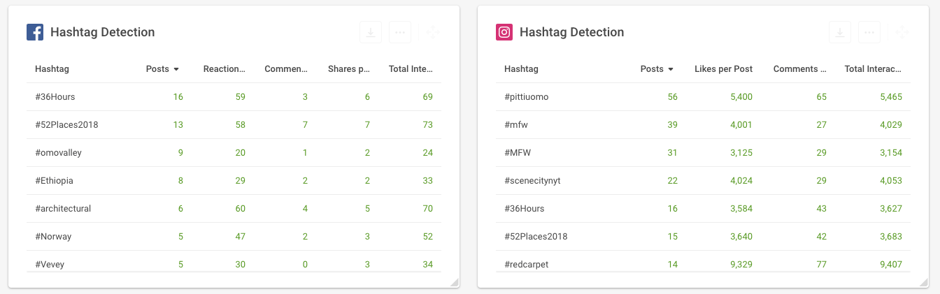
Step 4: Take a Closer Look at Hashtag Detection based on Interactions
It is not possible to share content on Instagram per default. Through this the possibilities to leave your own network is pretty limited. Still, if you use features such as tag people, places or use hashtags your posts can still be seen by people who do not follow you. To utilize the power of hashtags the performance should be measured constantly. Therefore our Hashtag Detection analyzes all hashtags being used from the profiles you are tracking. This sheds light on the best hashtags to use.
As soon as your brand or clients are on Instagram, KPIs need to be tracked to stay a step ahead of the competition. Once setup, you will feel the impact on your decision-making.
Furthermore, you are able to identify trends in hashtags being used for events or seasonal phenomena. To control the hashtags you use on a daily basis can make a big difference by reaching the correct audience. It should thus definitely be on your list for the most essential Instagram KPIs and Instagram Analytics should be part of your social media routine.
Recommended Readings
Our detailed Instagram Analytics Guide
How to ace your Instagram Account
Learn how to craft the perfect Instagram post

Join the conversation. Leave us a comment below!