

This article has been updated for you on January 22, 2020.
Without a doubt, Instagram stories is one of the most hyped features in the social sphere these days, with over 500 million daily active users. From a consumer perspective, it can be incredibly entertaining, not to mention arguably quite addictive, even to the point people could soon be spending more time here than watching TV. It doesn’t seem so far fetched, does it? Now, let’s dive into how to analyze Instagram stories.
For companies and businesses, the feature offers countless possibilities to increase Instagram engagement as well as traffic and sales. Seb Joseph from Digiday states in a recent article Instagram stories are the brand-building play of the minute.
This post will show how to approach Instagram story analytics in order to get the most of it and optimize how you sell your brand on the platform.
Instagram Story Analytics: Swipe up!
In order to access insights on Instagram stories you simply swipe up on the story you want to analyze. Here you will get the most valuable insights. There is also data available in the top right on your account page but data here is comparatively limited. Today, we’ll be looking at insights data from wavesnbackpack, a travel & surf blog, and a personal side project of mine. So I hope you enjoy the trip through Myanmar! Now let’s get going.

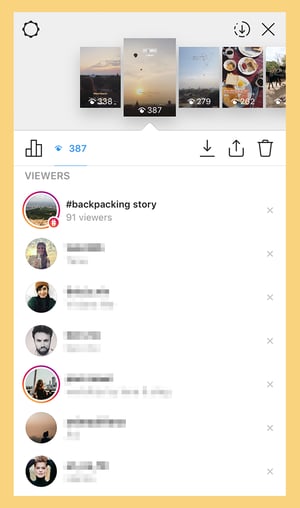
After swiping up on your Instagram story, you will end up on this overview. Here, you can examine the number of people that viewed the specific story post and who these users are.
The main Instagram story metrics
When clicking on the bar chart icon on the left hand side, you will come to the analytics screen giving you some numbers and insights at a quick glance.
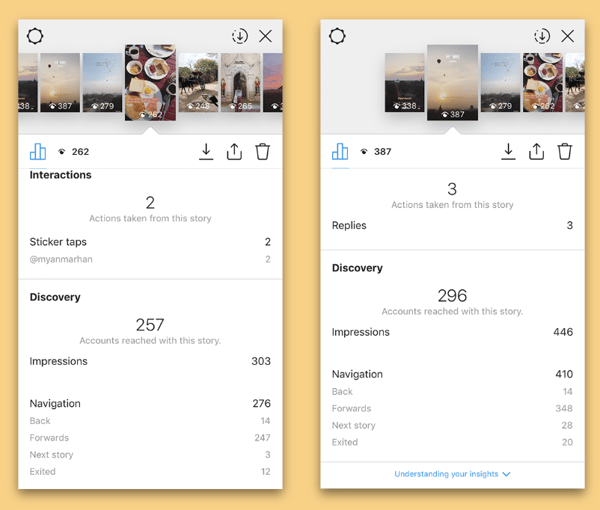
As many different numbers are displayed in this helpful overview, the following will lead you through the meaning of each and every metric.
Take your time to read and understand the terminologies, as they often sound quite similar but can mean something entirely different.
Actions taken
Here Instagram displays the number of actions taken from this story. These could be replies, sticker clicks (hashtag, location or mentions), profile visits or swipe ups (to IGTV or external links).
In this specific case wavesnbackpack received three replies on this story. Unlike the comment function these replies are not public but rather can be read and answered in your private inbox.

Instagram Stories tip: Check your inbox on a regular basis. Responses from people you do not follow can be missed easily!
In this case we received a request of a page with over 35k followers if they are allowed to repost our Myanmar images. Insta Story already paid off!
Sticker taps
Sticker taps can be an important metric when working together with a brand. In the example I mentioned the hotel Myanmar Han. Out of 262 views 2 clicked on it (and it became more after I took the screenshot). This is a great indicator for good content, as I managed to rise enough interest that users clicked on it, leaving their flow, meaning they are highly interested.
Through this metric you can prove the effectiveness of your Instagram stories if you work together with companies to show results of your work as every profile visit is valuable for a business. When running Instagram ads, businesses pay money to get more profile visits.
Keep in mind: Visits followed by a recommendation are much more effective on average and thus worth more.
Discovery - Reach
Reach is the number of people that viewed your Instagram story post so far. Reach is, as on Facebook, always a unique number and thus often called unique impressions.
>> Find out everything you need to know about the Reach metric here.
Impressions
In contrast to reach, impressions show how often content was seen by people you reached. As one user can view one story (or any other content piece) multiple times, thus impressions are at least equal but mostly greater than reach.

Navigation
Here you can see how users maneuvered through your Instagram stories!
BackPeople who clicked back, were really interested in the story you posted before. This can be a great indicator for a good content fit in the story before, if this number is high.
ForwardsThis does not necessarily mean that your stories are boring or the content does not fit the audience. Many people watch stories with the finger already lying on the right edge of the screen to speed up the story game. In the specific stories we look into here, I just posed pictures, that’s why this number is naturally pretty high, as there is rarely a need to stay at one picture for 15 seconds.
Of course, a low number here is a great indicator for very strong content but no need to worry if the number tends to be higher. Here, always have an eye on the content you are referring to. The time remained on an image always will be lower as the time remained on a video.
Instagram Stories tip: In order to slow people down in your stories, also include videos on a regular basis. Do not hesitate to show your face to the community!
Next StoryOk, this is pretty bad! Swiping over to the next story means you lost the viewer. However, this can have multiple reasons.
In the specific case I am taking a look here, you can identify that the right image performed significantly better overall which also applies for next story clicks. Food content just seems to work but frankly, the breakfast was super yummy!
ExitedThis viewer is also lost but that does not necessarily mean because of you or your content. It could also be that he or she arrived at the desired train station or colleagues dared to interrupt the enjoyment of your stories and ask work-related questions. Basically “exits” are apps closed within viewing your stories.
Increase reach on Instagram stories
Hashtags are a great way to reach people that are interested in a specific topic. In this case, the hashtag “backpacking” was able to generate 91 views. If these people like your story, they might follow you and interact with the next images or story posts.
For the analyzed travel and surf blog it took me a bit to find the right hashtags. To determine hashtags with the highest reach you need to trial and error and closely monitor the success.
Interestingly, “backpacking” works really well, “backpacker” does not. Same goes for the hashtags when it comes to surfing. Here “surfing” outperforms “surfer” by far.
Beside hashtags, location tags can boost your Instagram Stories performance also. Using this “sticker” displays your story in the location you are or have been. People who are planning a trip to Myanmar, in this specific case, can get a feeling of the Asian country from the couch at home.
How you can analyze Instagram stories within quintly
At quintly, we've always strived for easy access to central metrics. In our “Active Story Table” you can analyze the most important, above-mentioned metrics, in one table. With the differentiation of “Image” or “Video” you can immediately understand potential effects and differences in performance.
You can now also track all actions taken on the individual Instagram story, even when these stories already expired. This new feature allows you to have a closer look on how your content performed over time.
Here's an example on how an analysis of your received Taps looks like in quintly: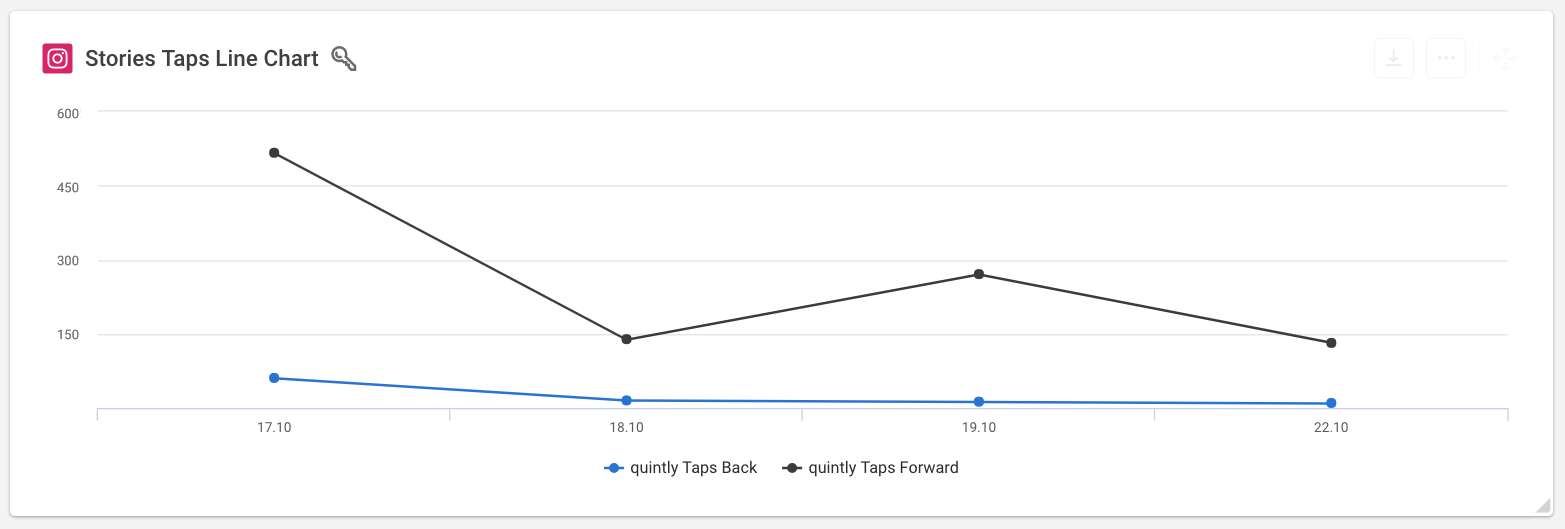
This visualization massively helps you to identify positive or negative trends over time. The numbers you receive on Instagram are a great start but or analyzing your brands performance on scale, over-time-developments are essential to know.
Do you want to know more about the Instagram stories feature in quintly? Have a look at our dedicated article.
Any hiccups while posting Instagram stories or while diving into your Insights data? Just reach out to me on Twitter or leave a comment!
Related Articles
Short-form Video Content & Stories
Our most complete guide on Instagram Stories
How to collect customer feedback with Instagram Stories
Instagram Study: What we learned analyzing 5.4 million posts
6 Hacks that will take your Instagram Stories to the next level

Join the conversation. Leave us a comment below!