
This article has been updated for you on October 22, 2019.
Last week I read “There is no such thing as B2B communication, as people like you and me also work in corporations”. This sentence serves both as a strong and controversial starting point for the following article. I want to describe to you ways how companies can measure LinkedIn performance. This can be used as a step-by-step guide in approaching the strategy optimization of the second “blue giant” – LinkedIn.
This article’s goal is to showcase how to set up a LinkedIn strategy that constantly improves. To create this, the cornerstone needs to be an always-questioning-your-current-strategy model. For this particular reason, we created the Social Media Analytics Cycle. This framework helps our clients to find the best social media KPIs, measure them and adjust initiatives in the future.
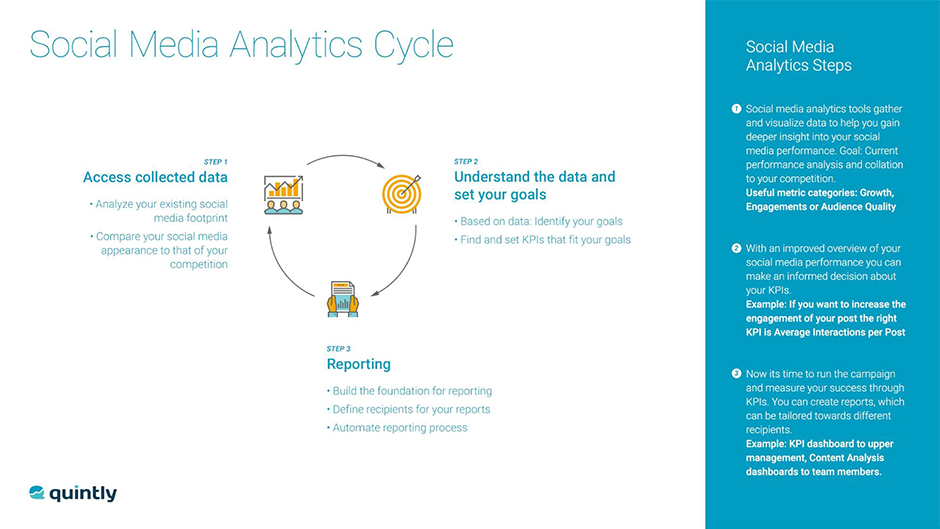
The first step of our framework is to have a look in the past. It digs deeper in what happened, what worked best and what didn’t achieve expected results. Ideally you would also apply this to your competition. To do so you can either use the default analytics features of all social networks or use a social media analytics tool such as quintly. The perk here is that you don’t need to worry about error-driven Excel sheets and save a lot of time with a tool that’s built to help you approach the analysis in an efficient way.
After you have received an understanding of the past, what you need to do is completely understand the data. This might sound trivial, but it’s often the most important, and equally difficult, step.
With the social media analytics cycle as a basis, you can get a more detailed view on metrics that eventually can work as new LinkedIn KPIs in the future. The last step of our cycle – as the process needs to be constantly repeated – is the report setup. If you need further information on how to set up a social media report, our “Social Media Reporting” article is a recommended reading.
The most important KPIs to measure LinkedIn Performance
Personally, I like to start an analysis with general metrics, providing the recipient with a birds-eye view. This is not necessary if the report is just being sent to the own team as these recipients know the game already.
If ‘externals’ – for example your boss, upper management or your client – receives the report, it is recommended to start with an easy metric. That’s why I would start with one of the easiest to understand (but simultaneously very relevant) metrics – The Followers Total and Follower Change.
Now, the basics are clear, let’s jump into our LinkedIn analysis.
As there is no more access to public post data for any LinkedIn Company Page since October 2019 we picked our own LinkedIn profile as an example.
Let’s show you how we make use of LinkedIn for our company.
Followers Total / Followers Change Rate
The first two metrics we take a closer look at, are company followers and the change of followers in the analyzed period. This basic metric visualizes the gain of followers at a glance.
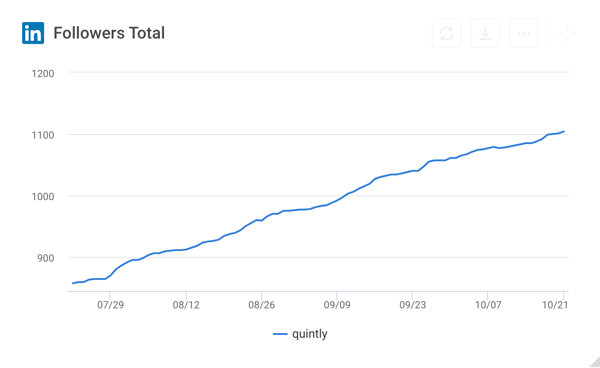
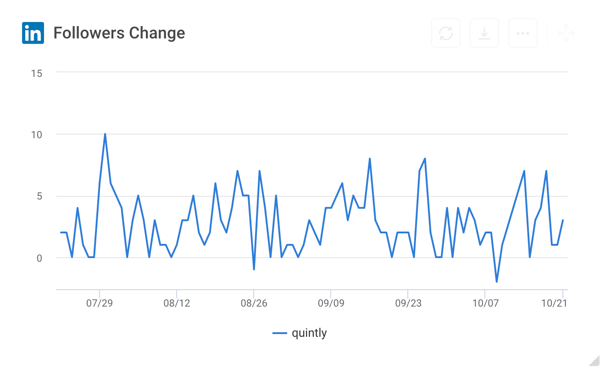
The spike in followers on July 30th is catching the eye immediately. Here it would be worth spending a bit time to investigate the reason.
LinkedIn Analytics Tip: Don’t focus on the obvious. Try to find values where it is worth digging into.
Average Interactions Per Post
Once the followers and their latest development set the starting point for a deeper analysis, we can jump right into it. In the analysis shown we would now have a closer look at the average interactions received.
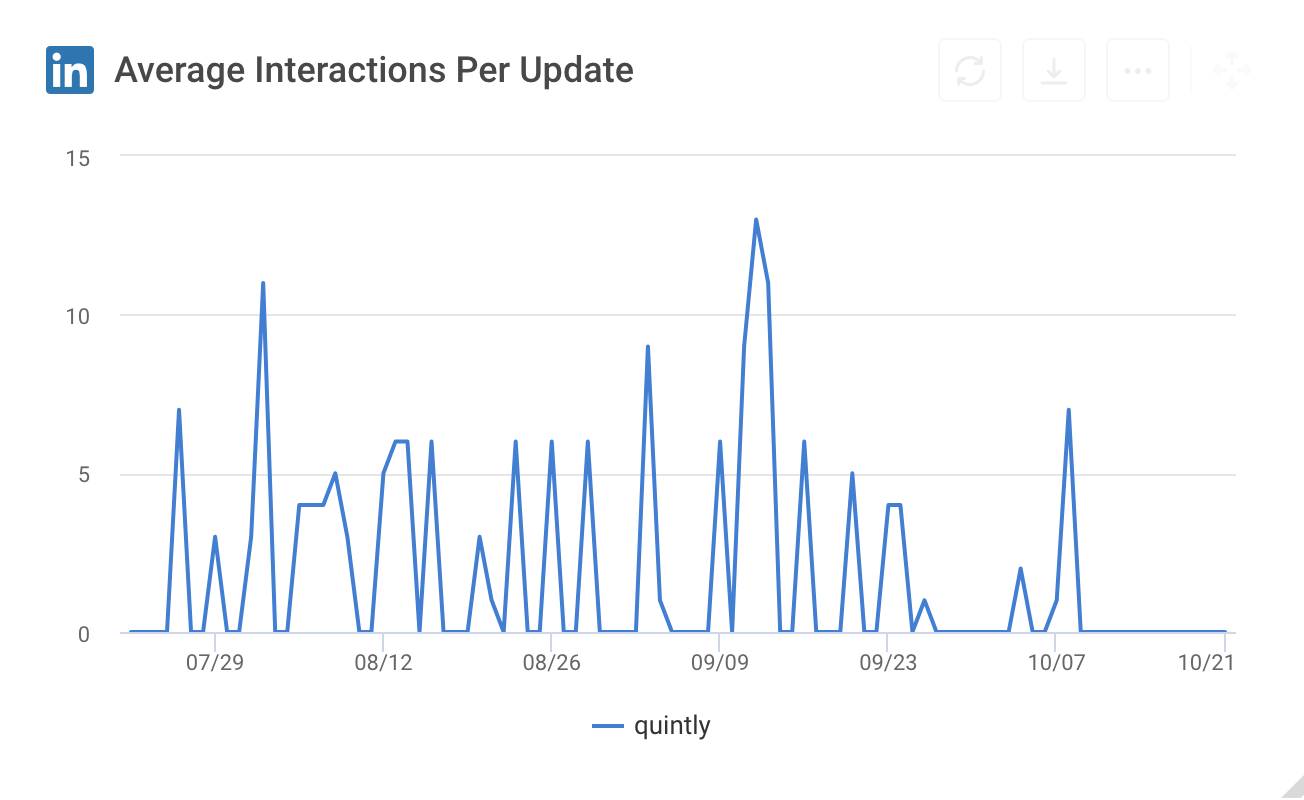
This LinkedIn metric provides information on your own interactions in the analyzed period. It shows peaks, where analysts then need to find an answer to the question which content seems to work best.
Update / Interaction Comparison
The above-mentioned metric Average Interaction Per Post visualized the interaction achieved in one graph. That’s handy, but now we need to figure out why some posts exactly worked better than others. Here we consider the ideal posting time on LinkedIn.
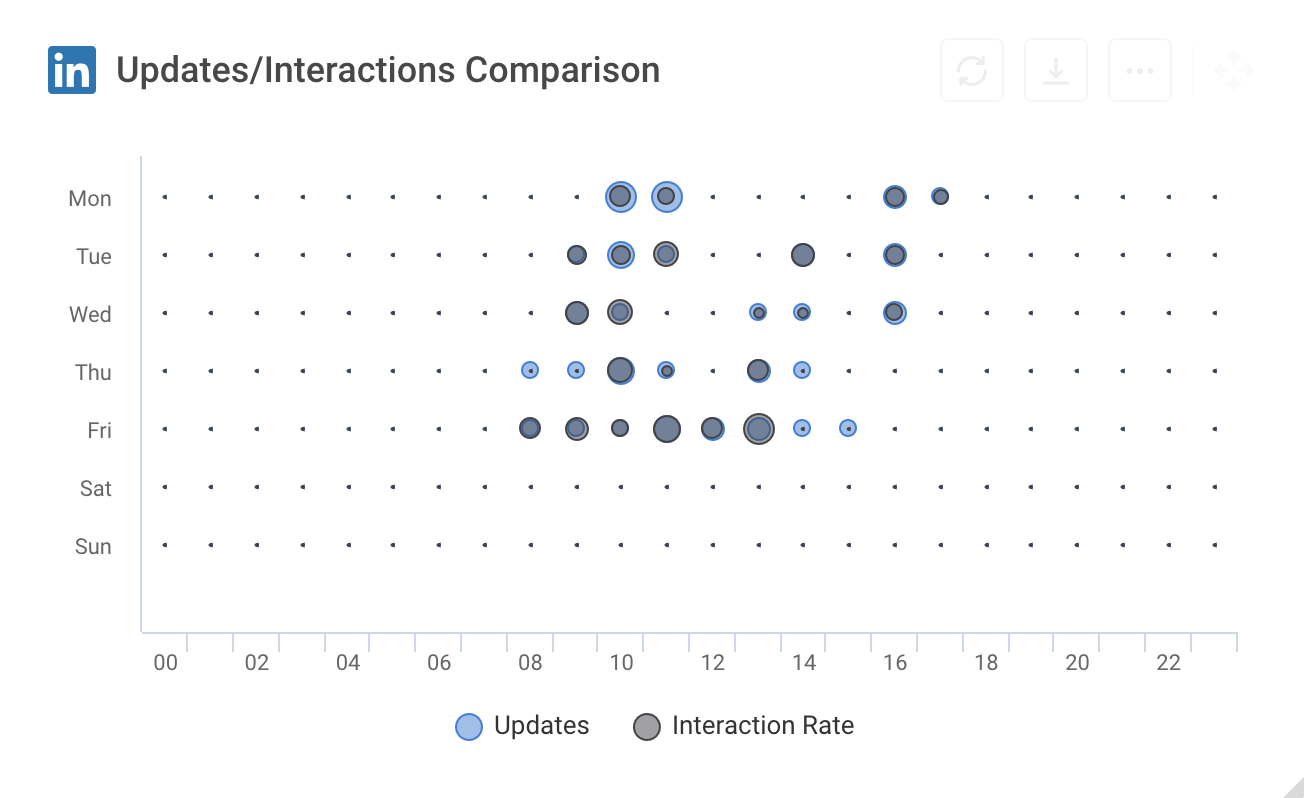
The blue bubbles visualize the published updates, whereas the grey balls show the Interaction Rate. Meaning to say, the bigger the grey bubble, the more interaction received.
Sometimes you spot posting times where the grey bubbles are bigger than the blue ones. In these times, the social media team might consider posting more frequently.
LinkedIn Analytics Tip: Marketers seem to put a lot of effort into finding the ideal posting times on Instagram, Facebook and Twitter. The exact time when to post on LinkedIn is equally important.
If you should identify less blue bubbles in the analysis of your profile, we suggest that you test, if posting more also leads to higher reach and more interactions. If that’s the case and interaction wouldn’t decline, this metric identified a great area of improvement.
LinkedIn Posts Table
Now this is a new metric with all of your private statistics. It doesn't only offer an overview of all published posts and the likes, comments and shares they’ve achieved but also additional metrics like impressions, clicks and views that were not present within our public data sets before.
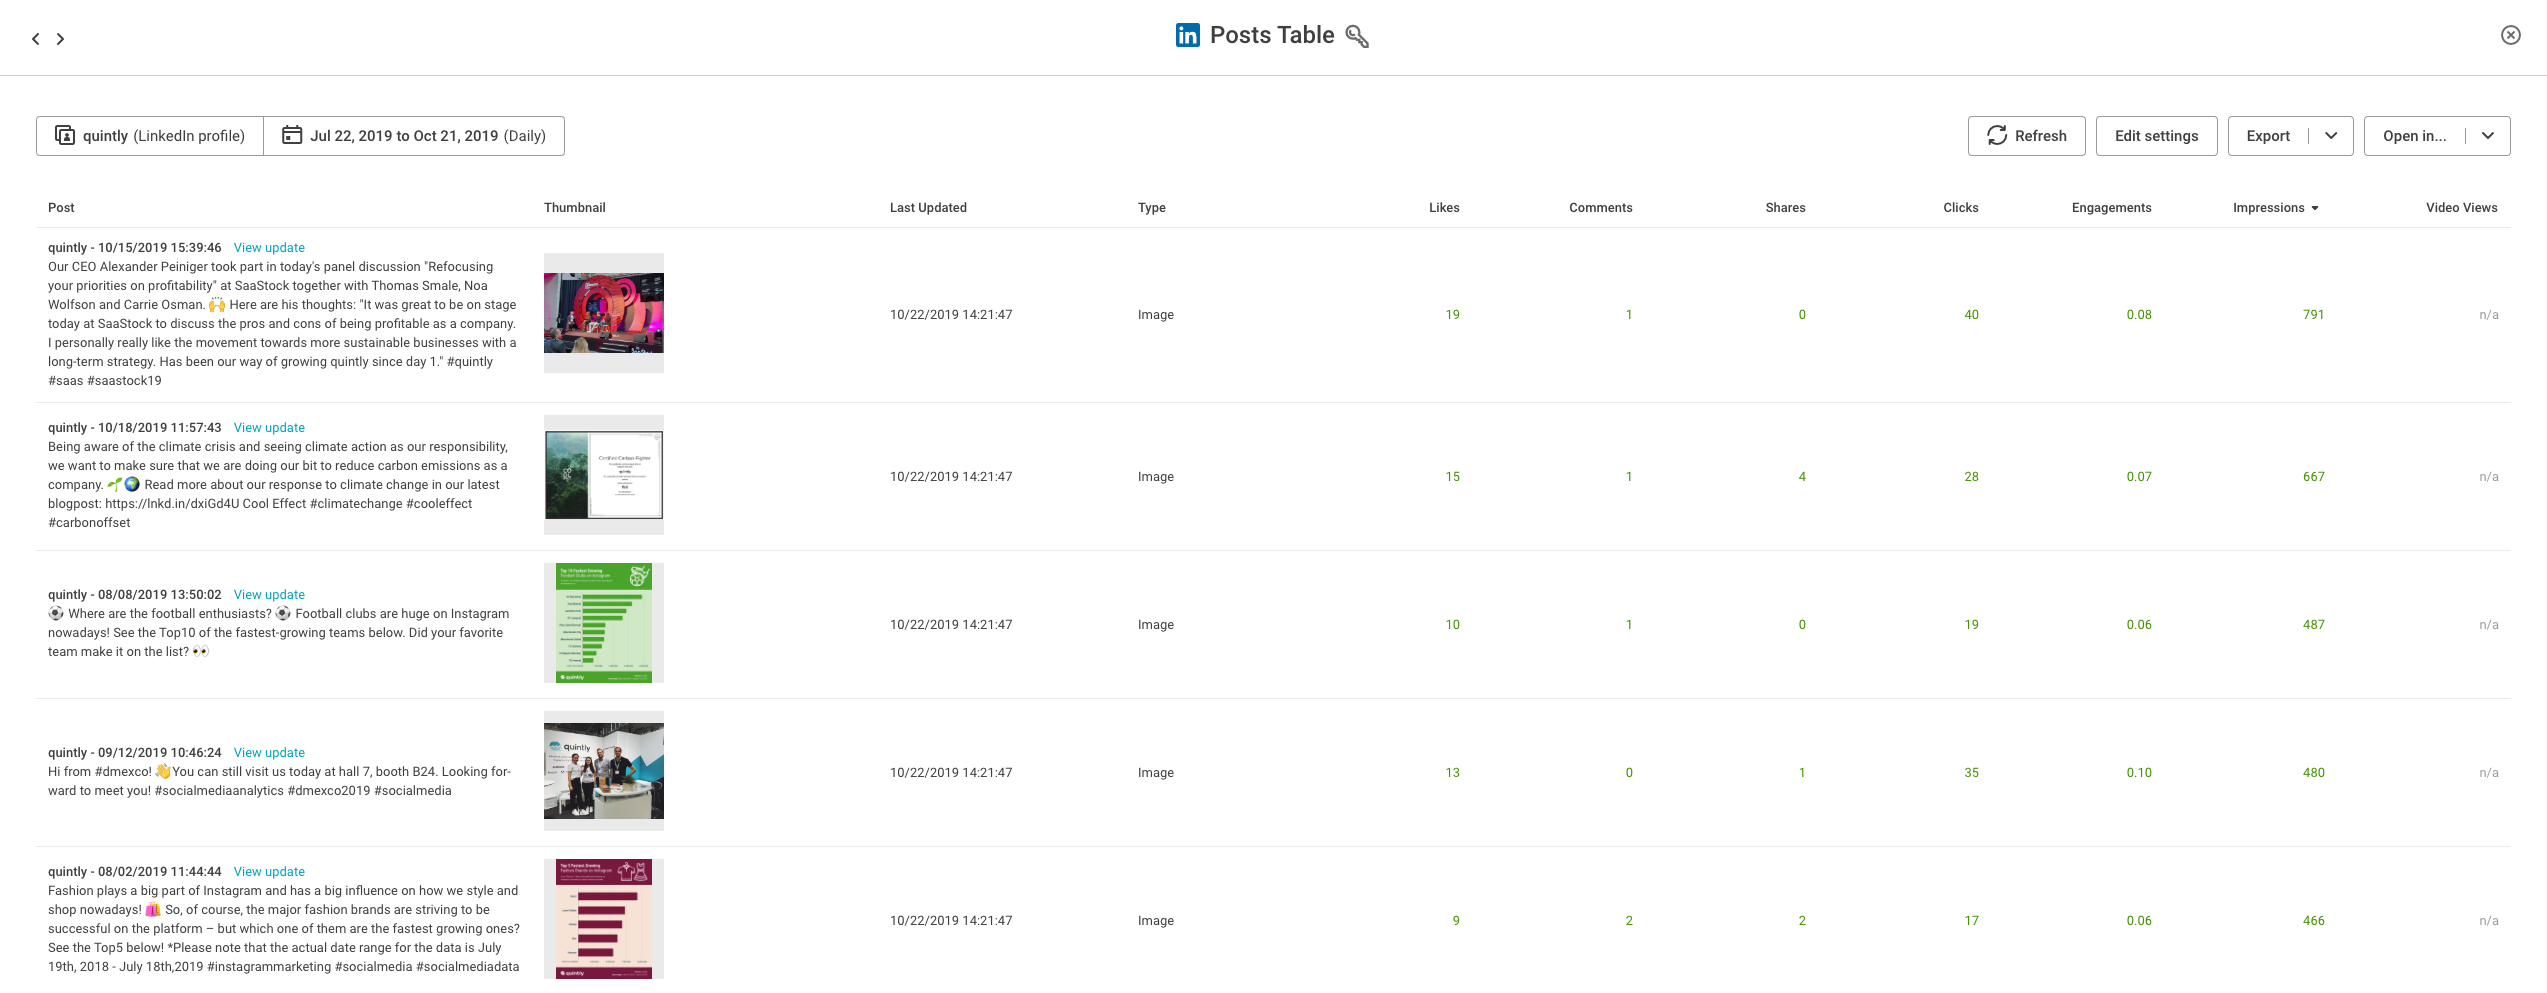
This table is just necessary in the analysis when you want to show the updates that have been published and if you want to dive deep into posting patterns and style.
In some cases, for example to the upper management, that might not be important. For other cases, such as reporting to your social media team, this metric is crucial as you can rank the posts based on their Reach or another important KPI. This way you can e.g. identify your Top 5 posts of the month fast and easily.
Interaction Distribution
Of course, the choice of every metric is related to your goals. Metrics answer questions and these need to be formulated very clearly. Many strategies aim towards a specific type of interactions. An example could be that a company created an infographic that aims towards receiving many shares and a controversial article and perhaps a job posting is supposed to get a high number of comments. This LinkedIn metric provides analysts with a more detailed view of the distribution of interaction – for yourself as well as the competition.
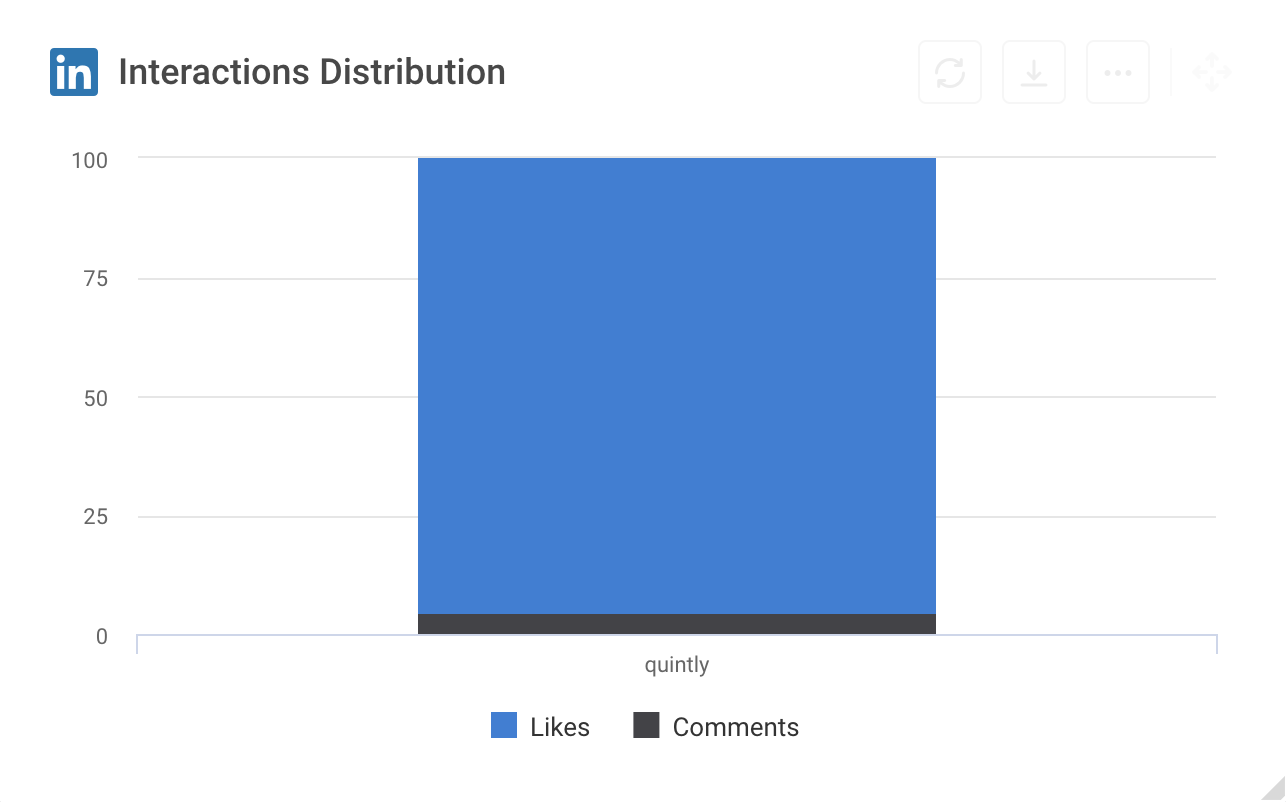
As you can see, we get a smaller amount of comments compared to likes.
This can be different in your specific case!
Going one step further - LinkedIn Insights
For a holistic analysis, checking the networks default analysis function is also recommended. Some data points are not available for externals such as quintly or any other social media analytics tool. By digging in the networks default insights, you can gain a deeper, very important understanding of your followers. This can helpful while creating content, job postings or when targeting ads. LinkedIn offers you a couple of options in the drop-down menu, so be sure to use all possibilities you have.
LinkedIn Performance Report
At the end of an analysis you normally want to report your findings to somebody, or a group of people. Ideally this should be done automatically. After you decided on metrics you consider as most important for your specific use case and bundle them on a dashboard, you can now set up a report with a couple of clicks within quintly. Just schedule it, type in the emails of the recipients, and it’s a done deal! Now Zack, Alex and Sarah, for example, receive the reports you set up automatically every Monday before your weekly sync.
B2B Marketers, your turn!
The most important thing to keep in mind for every analysis is to focus on asking the right questions. Once you are clear about your LinkedIn strategy and you have a crystal-clear goal in mind you can set up an analysis, decide on metrics and identify the most important KPIs.
Lastly, always try to gather as much data as you can get. Therefore, you use a tool like quintly on top the networks default analytics.
Recommended Readings
Employer Branding & the Human Side of Social
LinkedIn Marketing for five Corporations
LinkedIn Strategy – 3 essential KPIs
Find the best Social Media KPIs
Our complete guide to LinkedIn Marketing

Join the conversation. Leave us a comment below!